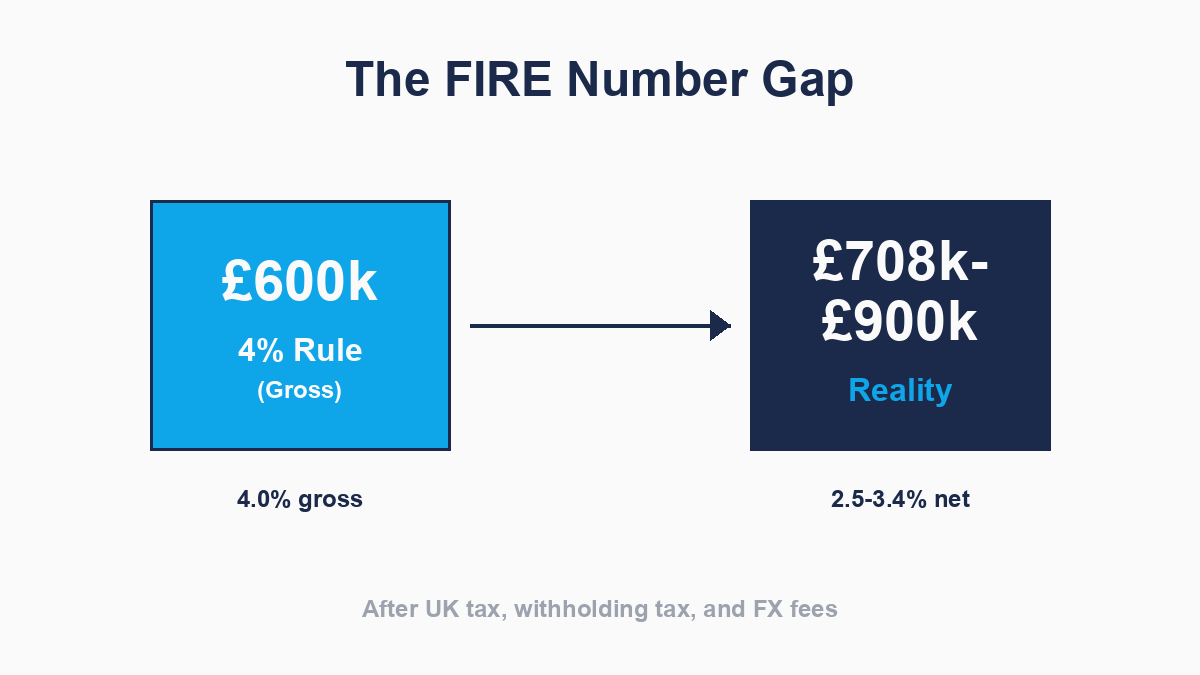
You've done the research. You know the formula. Take your target annual income, multiply by 25, and that's your FIRE number — the portfolio size you need to achieve financial independence. Want £24,000 a year? You need £600,000. It's the bedrock calculation of the FIRE movement, repeated in every forum, every blog post, every financial independence calculator you've ever used.
But if you're a UK dividend investor building your path to independence on gross yields, you're aiming at the wrong target. The 4% rule was built on US market returns in tax-deferred accounts. For UK investors facing withholding tax, FX conversion fees, and UK dividend tax, your effective net yield could be as low as 2.5-3.4% — not 4%. That means your actual FIRE number could be 33% to 50% larger than the textbook formula suggests. And if you don't know the real number, you'll hit your "target" only to discover you're years away from actual independence.
Where the 4% Rule Comes From — And Why It Doesn't Translate
The 4% rule originated from William Bengen's 1994 research paper, Determining Withdrawal Rates Using Historical Data, and was later validated by the Trinity Study in 1998. Both studies analyzed US stock and bond returns from 1926 to 1995, testing how much retirees could safely withdraw each year without running out of money over a 30-year retirement horizon. The conclusion: a 4% initial withdrawal rate, adjusted for inflation, had a high probability of success across various market conditions.
The Real Driver of Total Return
What many investors overlook is just how much of that total return was actually driven by dividends. According to research from Hartford Funds, 85% of the cumulative total return of the S&P 500 Index since 1960 can be attributed to reinvested dividends and the power of compounding. On an average annual basis, dividends contributed approximately 30% of total returns.
But here's what most UK investors miss: those studies were based on gross total returns in tax-deferred accounts. The S&P 500 returned roughly 10.5% annualized during that period, with dividends reinvested. The 4% withdrawal rate assumed you were accessing that full return — no withholding tax deducted at source, no UK dividend tax applied on top, no FX conversion fees chipping away at your income.
For a US investor in a 401(k) or IRA — tax-deferred retirement accounts where withdrawals are taxed as ordinary income only when taken — the 4% rule is a reasonable starting point. For a UK investor building independence on dividend income from an ISA or GIA, the mechanics are entirely different. The deductions happen before the money reaches your account, and they're invisible if you're planning based on gross yields.
The Three Layers of Deduction
UK dividend investors face a deduction chain that the 4% rule never accounted for:
-
US withholding tax (15%) — Applies to all US dividends, even in an ISA. Deducted at source before you receive the payment. Non-recoverable inside an ISA wrapper.
-
FX conversion fees (0.5-1.50%) — Charged by most brokers to convert foreign dividends back to pounds. While platforms like Trading 212 exempt dividends from their 0.15% fee, others embed a wider spread or charge a flat fee, making it nearly invisible unless you're tracking it manually.
-
UK dividend tax (8.75-39.35%) — Applies to GIA dividends above the £500 allowance. Varies sharply by income tax band. Increasing from April 2026 (basic rate rises to 10.75%, higher rate to 35.75%).
We covered these in detail in Episode S1E01 (withholding tax and FX fees) and Episode S1E02 (UK dividend tax). This episode connects those deductions to the one number that matters most: how much do you actually need to achieve financial independence?
Scenario 1: ISA-Only Investor with US Stocks
Let's start with the best-case scenario — a UK investor who has maxed out their ISA contributions for years and built a £600,000 ISA portfolio invested in US dividend stocks yielding 4% gross. No UK dividend tax. But you still face US withholding tax and FX fees.
The textbook calculation:
- Target annual income: £24,000
- Portfolio size at 4% yield: £24,000 ÷ 4% = £600,000
The real calculation:
-
Gross annual dividends: £600,000 × 4% = £24,000
-
Less US withholding tax (15%): £24,000 × 15% = £3,600
-
Net received: £20,400
(Note: Trading 212 exempts dividends from its 0.15% FX fee; other brokers charging 1% would reduce this to £20,196).
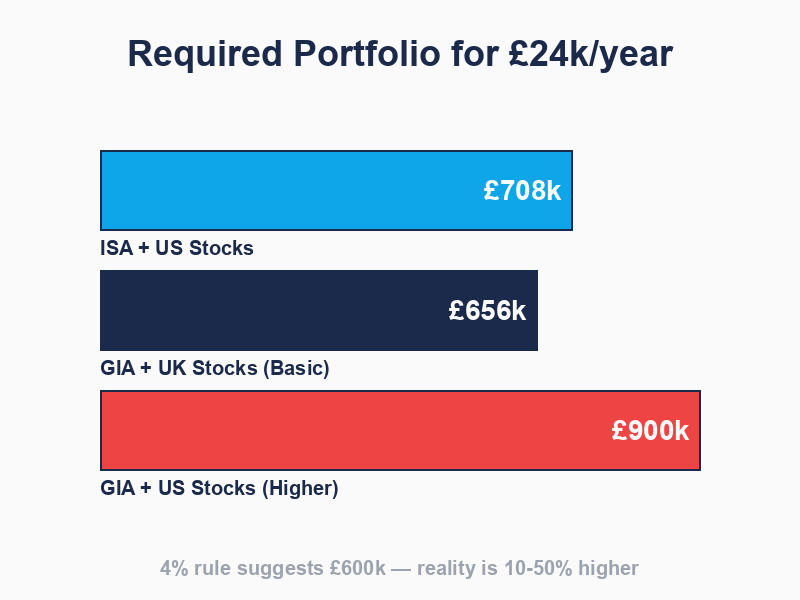
Your effective net yield is 3.40%, not 4%. To actually generate £24,000 net, you'd need:
£24,000 ÷ 3.40% = £705,882
That's over £100,000 more than the 4% rule suggests — an extra 17.6% on top of the headline figure.
And this is the best-case scenario where you're not paying UK dividend tax at all.
The ISA Timeline Gap
Here's where the reality gets even harder. Building a £600,000 ISA takes time — lots of time. The annual ISA contribution limit is £20,000 (frozen until April 2031). Even with growth on your side, you're looking at 16-19 years to reach £600,000:
| Annual Growth Rate | Years to £600k | Total Contributed | Growth |
|---|---|---|---|
| 5% (moderate) | 19 years | £380,000 | £220,000 |
| 7% (historical equity avg) | 16 years | £320,000 | £280,000 |
| 10% (optimistic) | 14 years | £280,000 | £320,000 |
But if your actual target is £708,000 (not £600,000), add another 1-2 years to each of those timelines. The invisible deductions don't just reduce your income once you're there — they push your independence date further out.
And that assumes you're investing in US stocks yielding around 4%. The FTSE 100 average yield is currently 3.4%, which would require an even larger portfolio to hit your net income target.
Scenario 2: Basic Rate Taxpayer with UK Stocks in a GIA
Not everyone has the luxury of waiting 16+ years to build an ISA-only portfolio. Many investors are accumulating in both an ISA and a GIA simultaneously, especially if they're investing more than the £20,000 annual ISA limit. This scenario assumes a basic rate taxpayer with £600,000 in a GIA, invested in UK dividend stocks yielding 4% gross.
The textbook calculation:
- Target annual income: £24,000
- Portfolio size at 4% yield: £24,000 ÷ 4% = £600,000
The real calculation:
- Gross annual dividends: £600,000 × 4% = £24,000
- Less dividend allowance: £500 (tax-free)
- Taxable dividends: £24,000 - £500 = £23,500
- UK dividend tax (8.75% until April 5, 2026): £23,500 × 8.75% = £2,056.25
- Net received: £24,000 - £2,056.25 = £21,943.75
Your effective net yield is 3.66%. To generate £24,000 net, you'd need:
£24,000 ÷ 3.66% = £656,000
That's £56,000 more than the 4% rule suggests.
But here's the kicker: from April 6, 2026, the basic rate dividend tax increases from 8.75% to 10.75%. Your net would drop to £21,443.75 (3.57% yield), requiring £672,000 for the same £24,000 net income. The gap is widening.
The Tax Erosion Over Time
Let's put this in perspective. At £656,000 invested, you're paying roughly £2,290 per year in UK dividend tax (from April 2026). Over five years, that's £11,450 — enough to fund more than half of your next year's ISA contribution. If you'd migrated those holdings into an ISA wrapper earlier, that tax leakage would be compounding in your favor instead of evaporating to HMRC.
The earlier you start shifting GIA holdings into ISA protection, the less cumulative tax you'll pay on your path to independence. But the £20,000 annual limit means a £100,000 GIA takes five years to fully migrate — and you're paying tax every year during that transition.
Scenario 3: Higher Rate Taxpayer with US Stocks in a GIA
This is where the deduction chain stacks up brutally. You're a higher rate taxpayer (income over £50,270) with a £600,000 GIA portfolio invested in US dividend stocks yielding 4% gross. You face all three layers of deduction: US withholding tax, FX fees, and UK dividend tax at the higher rate.
The textbook calculation:
- Target annual income: £24,000
- Portfolio size at 4% yield: £24,000 ÷ 4% = £600,000
The real calculation:
- Gross annual dividends: £600,000 × 4% = £24,000
- Less US withholding tax (15%): £24,000 × 15% = £3,600
- Cash received in broker: £20,400
UK tax calculation (with Double Taxation Relief):
- Taxable dividends (gross): £24,000 - £500 = £23,500
- UK tax at 33.75%: £23,500 × 33.75% = £7,931.25
- Foreign Tax Credit (DTR): £24,000 × 15% = £3,600 (already paid to US)
- Net UK tax payable: £7,931.25 - £3,600 = £4,331.25
Final net:
- Net received: £20,400 - £4,331.25 = £16,068.75
Your effective net yield is 2.68%. To generate £24,000 net, you'd need:
£24,000 ÷ 2.68% = £895,522
That's £299,000 more than the 4% rule suggests — a 50% increase on the headline figure. You'd need to almost double the timeframe implied by the textbook calculation.
And again, from April 6, 2026, the higher rate increases to 35.75%, pushing your net yield down to approximately 2.54%, requiring £945,000 to achieve the same £24,000 net income.
The Compounding Cost of Delay
Let's talk about what this actually means in years. If you're investing £20,000/year in your ISA at 7% annual growth, it takes roughly 16 years to reach £600,000. But at 2.68% net yield, you don't need £600,000 — you need £895,522. At the same contribution and growth rate, that's approximately 21-22 years instead of 16.
You've just added 5-6 years to your path to independence because you were planning based on gross yields instead of net.
That's the real cost of the 4% rule myth for UK investors. It's not just about having a bigger number on paper — it's about years of your life spent working when you thought you'd already be free.
The One Scenario Where 4% Gross Equals 4% Net
There is exactly one scenario where the 4% rule works as advertised for UK dividend investors: if your entire portfolio is held in an ISA and invested exclusively in UK dividend-paying stocks.
- No US withholding tax (UK stocks only)
- No FX conversion fees (GBP dividends only)
- No UK dividend tax (ISA wrapper)
Four percent gross would genuinely be four percent net.
But that strategy comes with its own risks: zero international diversification. You're concentrating everything in one market, exposed to UK-specific economic and political risk, with no hedge against sterling weakness. The FTSE 100 is heavily weighted towards financials, energy, and mining — you're missing exposure to the technology, healthcare, and consumer sectors that dominate US markets.
International diversification is a core principle of sensible portfolio construction. But the moment you add US or international stocks to achieve that diversification, you're back in the deduction chain. Most dividend investors end up with a mix of UK and international holdings, which means their effective net yield lands somewhere between the scenarios we've walked through.
The question isn't whether to diversify — it's whether you're planning your FIRE number based on the real net yield you'll actually receive from that diversified portfolio.
How to Calculate Your Personal Net FIRE Number
Your real FIRE number depends on four variables:
- Your target annual income (e.g., £24,000/year, £30,000/year, £50,000/year)
- Your income tax band (basic, higher, additional rate — determines UK dividend tax)
- Your account mix (ISA vs GIA — affects UK dividend tax exposure)
- Your portfolio geography (UK vs US/international — affects withholding tax and FX fees)
The calculation looks like this:
Step 1: Calculate your effective net yield
Start with your portfolio's gross yield. Apply the relevant deductions:
- US/international stocks: -15% withholding tax, -0.15% FX fee (Trading212)
- GIA holdings: -UK dividend tax on gross amount above £500 allowance
Step 2: Divide your target income by your net yield
Target Income ÷ Net Yield = Required Portfolio Size
Worked Example: Mixed Portfolio
Say you're targeting £30,000/year net income. Your planned portfolio is:
- 60% UK stocks in ISA (3.5% gross yield)
- 40% US stocks in ISA (4.0% gross yield)
You're a higher rate taxpayer, but because everything is in an ISA, you don't owe UK dividend tax. However, the US withholding tax still applies.
Net yield calculation:
- UK portion (60%): 3.5% gross = 3.5% net (no deductions in ISA)
- US portion (40%): 4.0% gross → 3.40% net (after 15% WHT)
- Weighted average net yield: (0.6 × 3.5%) + (0.4 × 3.39%) = 2.1% + 1.36% = 3.46%
Required portfolio size: £30,000 ÷ 3.46% = £867,052
If you'd planned based on a blended gross yield of 3.7% (0.6 × 3.5% + 0.4 × 4.0%), you'd have targeted £811,000. The real number is £56,000 higher — roughly three extra years of ISA contributions.
The ISA Migration Strategy
For most dividend investors, the optimal long-term strategy is clear: migrate as much as possible into ISA wrappers. ISA dividends are completely tax-free, eliminating UK dividend tax regardless of your income band. You'll still face US withholding tax on foreign stocks, but you'll avoid the second layer of UK tax that GIA investors pay.
But the £20,000 annual ISA limit means migration is a multi-year process. If you've got £100,000 in a GIA, it'll take five years of maxing out your ISA to fully shift those holdings — and you can't transfer holdings "in specie" (you must sell in the GIA and rebuy in the ISA, triggering Capital Gains Tax on any gains).
Priority order for ISA allocation:
- High-yield stocks first — The £500 dividend allowance breach happens fastest on high-yield holdings
- International stocks over UK stocks — US stocks face withholding tax regardless of wrapper, but at least you avoid the second layer of UK tax
- GIA holdings over new purchases — Migrate existing GIA holdings before deploying new capital
This isn't about avoiding tax entirely — it's about minimizing the cumulative tax leakage over the 10-20 year journey to independence. Every year you delay the migration is another year of avoidable dividend tax.
How to Track Your Progress
The problem with the 4% rule is it's a single static number — a target portfolio size. But your path to financial independence isn't static. Your dividend yields change as markets move. Your tax band changes as your salary increases. Your portfolio mix evolves as you rebalance and add new holdings. A fixed target can't account for all that.
What you actually need is a dynamic projection based on your current portfolio, updated continuously as your circumstances change.
Nestor's Independence Journey feature calculates this for you. Set your target monthly income (say, £2,000), and the app:
- Analyzes your actual holdings to determine your effective net yield
- Accounts for US withholding tax, UK dividend tax (based on your tax band), and FX fees
- Shows you what you're earning net today and how far you have to go
- Projects a timeline based on your contribution rate and expected portfolio growth
- Updates automatically as your portfolio changes
It's not a guarantee — yields fluctuate, markets move, tax rates change — but it's a reality-based calculation using your actual circumstances, not a generic 4% assumption from a 1998 US study.
You can track this manually with a spreadsheet, of course. But calculating net yields by geography, applying treaty-specific withholding tax rates, factoring in your tax band and account mix, and updating it quarterly as dividends arrive? That's the kind of tedious ongoing maintenance that most people start but few sustain. Automation removes the friction.
The One Thing to Remember
Your net FIRE number is bigger than the 4% rule suggests — but once you know what it actually is, you can plan for it.
The worst outcome isn't aiming for a higher number. It's hitting your "target" portfolio size, quitting your job, and discovering six months later that the money in your pocket is 30-40% less than you expected. By then, you've burned the bridge back to employment, depleted your emergency fund, and you're facing the choice between going back to work or living on far less than you planned.
Freedom has a number. Make sure you're aiming at the right one.