You see a 4% dividend yield on your broker screen. You do the quick maths: £10,000 invested, £400 a year in passive income. It looks clean, it looks simple, and it looks like money you can count on.
But here's the thing — that number is a fantasy. Between the company paying that dividend and the cash landing in your ISA, there are two invisible deductions that most UK investors don't discover until they've been collecting dividends for months and notice the numbers don't add up. By the end of this article, you'll know exactly where your money goes, how much you're really losing, and how to calculate your true net yield on any US stock.
The Headline Yield Problem
Every broker platform shows you the same thing: a stock's dividend yield as a single, clean percentage. It's the number that catches your eye when you're browsing for income stocks. A US pharmaceutical company showing 4.5%. An S&P 500 high-dividend ETF at 4.6%. These numbers make allocation decisions feel straightforward — higher yield means more income, right?
Not quite. What your broker shows you is the gross yield — the annual dividend divided by the share price, before any deductions. It's the financial equivalent of a salary figure before tax. Nobody would accept a job based on the gross salary without asking about take-home pay, yet that's exactly what millions of dividend investors do when they look at yield figures.
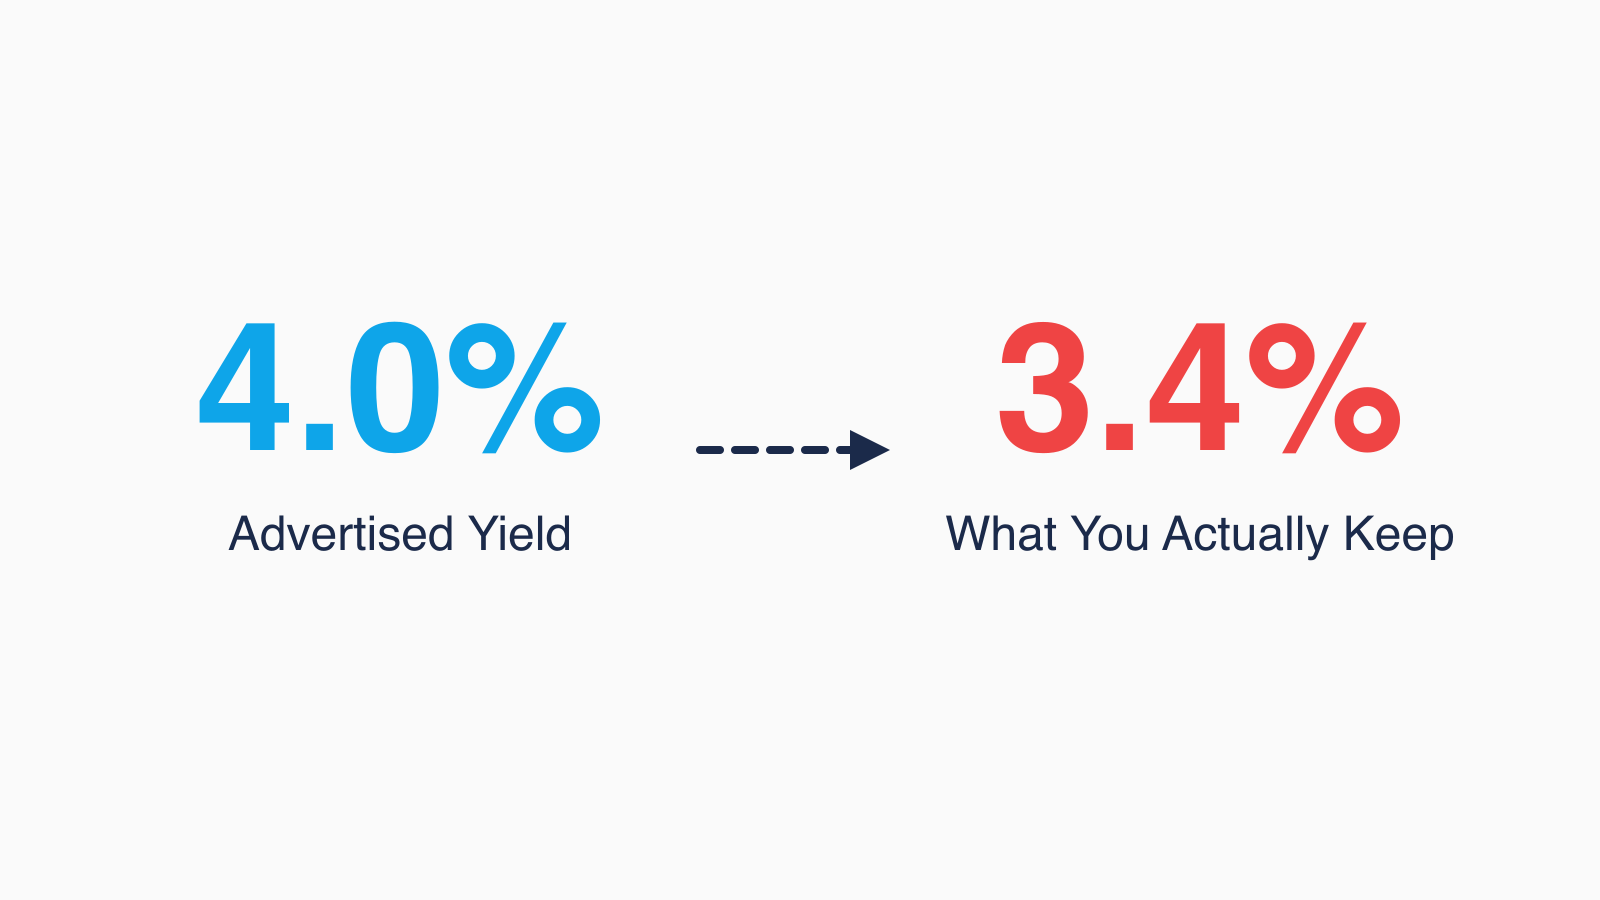
The invisible deductions happen in two stages, and neither one appears prominently on your broker's dashboard. The first is a tax that's taken before your dividend even leaves the United States. The second is a fee your broker charges to convert that dividend from dollars to pounds. Together, they can reduce a 4% headline yield to roughly 3.4% — a gap of 15–17% of the advertised figure.
US Withholding Tax — The 15% You Can't Avoid
When a US company pays a dividend to a non-US shareholder, the US government withholds tax at source. This is called withholding tax (WHT), and it applies to every dividend payment, every quarter, without exception.
The amount depends on whether you've completed a W-8BEN form — a one-page document that certifies you're a UK tax resident and qualifies you for the reduced rate under the US-UK double taxation treaty:
- With W-8BEN: 15% withholding tax rate
- Without W-8BEN: 30% withholding tax rate
Your broker will typically prompt you to complete the W-8BEN when you open your account or buy your first US stock. If you haven't done it, check your broker's settings — it's the single most impactful form you can fill in as a UK dividend investor. The difference between 15% and 30% is enormous: on a £1,000 dividend, that's £150 withheld versus £300. Once signed, the W-8BEN is valid for three years from the date of signing, after which you'll need to renew it. Most brokers will remind you, but it's worth keeping a note of the date.
Note that the 15% rate comes specifically from the US-UK double taxation treaty. Other countries have different treaty rates — or no treaty at all. This article focuses on US stocks, which make up the majority of international holdings for most UK investors.
Why your ISA does NOT protect you
This is the part that catches most people off guard. UK investors assume their ISA is a complete tax shield. For UK tax, it is — you pay zero income tax and zero capital gains tax on investments held inside an ISA wrapper. But the ISA does nothing about US tax.
The US government doesn't recognise the UK ISA as a tax-exempt vehicle. They see a dividend being paid to a non-US person, and they withhold their 15% (or 30%) before the money leaves the country. Your ISA protects you from HMRC. It doesn't protect you from the IRS.
Here's the really painful part: in a General Investment Account (GIA), you can sometimes offset withholding tax against your UK tax bill through double taxation relief. But inside an ISA, there's no UK tax to offset against — the ISA is already tax-free. So the 15% withholding tax is permanent and non-recoverable. It's simply gone.
The FX Conversion Fee — Death by a Thousand Cuts
Your US dividends are paid in US dollars. Your ISA is denominated in pounds sterling. Somebody has to convert that currency, and your broker charges you for the privilege.
The FX conversion fee is typically expressed as a percentage of the converted amount. It's deducted from the exchange rate you receive — your broker gives you a slightly worse rate than the market mid-rate, and the difference is their fee. This means it's rarely shown as a separate line item, making it even harder to spot.
Here's how the major UK brokers compare:
| Broker | FX Fee | Cost on £1,000 Dividend |
|---|---|---|
| Trading212 | 0.15% | £1.50 |
| Interactive Investor | 0.25–0.75% | £2.50–£7.50 |
| AJ Bell | 0.50–0.75% | £5.00–£7.50 |
| Hargreaves Lansdown | 0.50–0.99% | £5.00–£9.90 |
| iWeb | 1.50% | £15.00 |
Fee structures as of February 2026. Some brokers use tiered rates based on transaction size. Always verify current rates on your broker's website.
The difference is staggering. On a £1,000 annual dividend, you'd pay £1.50 with Trading212 versus £15.00 with iWeb — a tenfold difference. And because FX fees are charged on every single dividend payment, they compound across every quarterly (or monthly) payment throughout the year.
It's also worth noting that some brokers, like AJ Bell, charge a separate FX fee on dividends and corporate actions (0.50%) that's different from their standard trading FX fee. This catches investors off guard because they assume the trading rate applies to everything. Always check your broker's specific fee schedule for dividend-related FX conversions.
Unlike withholding tax, FX fees are something you can control. Switching to a lower-cost broker for your international holdings, or consolidating your US stocks with a broker that has competitive FX rates, is one of the simplest ways to improve your net yield.
The Full Deduction Chain — A Worked Example
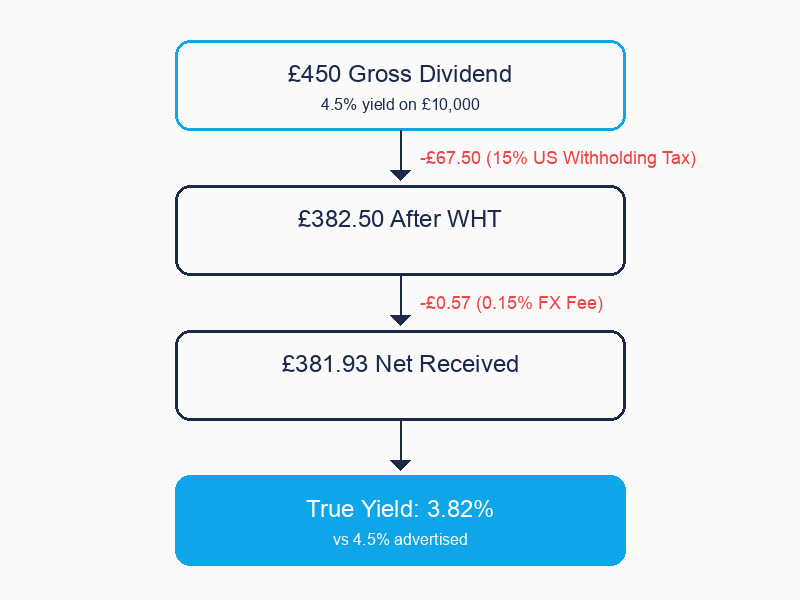
Let's make this concrete with a step-by-step walkthrough. Say you invest £10,000 in a US stock yielding 4.5% gross — a figure you might see on a company like Bristol-Myers Squibb (purely illustrative, not a recommendation). You're expecting £450 a year in dividends, paid quarterly at roughly £112.50 per quarter.
Here's what actually happens each quarter:
Step 1: Gross dividend The company declares a quarterly dividend. At an illustrative GBP/USD rate of around 1.25, your £112.50 expected dividend is approximately $140.63 in US dollars.
Step 2: US withholding tax (15%) The US government withholds 15% immediately: -$21.09. You now have $119.53. That $21.09 is gone — permanently, irrecoverably, no questions asked.
Step 3: FX conversion to GBP Your broker converts $119.53 back to pounds. Using Trading212's 0.15% FX fee:
- Market rate conversion: £95.63
- FX fee (0.15%): -£0.14
- Net received: £95.48
What you expected: £112.50 per quarter What you received: ~£95.48 per quarter
That's a shortfall of roughly £17 per quarter, or about £68 per year on a £10,000 investment. Your "4.5% yield" is actually delivering approximately 3.82% net.
And remember — that's with Trading212's industry-low 0.15% FX fee. With a traditional broker charging 1.50%, the FX fee alone would take another £5–6 per quarter, pushing your net yield even lower.
What if you're with a more expensive broker?
Let's run the same £10,000 / 4.5% gross example with different brokers to see how the FX fee compounds the withholding tax damage:
| Broker | FX Fee | Quarterly Net | Annual Net | True Yield |
|---|---|---|---|---|
| Trading212 | 0.15% | £95.48 | £381.93 | 3.82% |
| Interactive Investor | 0.25% | £95.39 | £381.55 | 3.82% |
| AJ Bell (dividends) | 0.50% | £95.15 | £380.60 | 3.81% |
| Hargreaves Lansdown | 0.99% | £94.68 | £378.73 | 3.79% |
| iWeb | 1.50% | £94.19 | £376.78 | 3.77% |
Based on £10,000 invested, 4.5% gross yield, 15% US WHT, illustrative GBP/USD rate of 1.25. Exchange rates vary daily.
The FX fee difference between cheapest and most expensive broker costs you roughly £5 per year on a £10,000 holding. That might not sound like much, but across a £50,000 portfolio it's £25 per year — and that's on top of the £300 you're already losing to withholding tax.
At Scale — What This Costs You Per Year
The real impact becomes clear on a larger portfolio. Consider a £50,000 portfolio generating a 4% gross yield from US stocks in an ISA:
- Gross annual income expected: £2,000
- After 15% US withholding tax: £1,700 (you've lost £300)
- After FX fees (Trading212 at 0.15%): ~£1,697.45 (another £2.55 lost)
- After FX fees (iWeb at 1.50%): ~£1,674.50 (another £25.50 lost)
Total invisible loss: £300–£325 per year, depending on your broker.
On the Trading212 fee structure, the 15% withholding tax is overwhelmingly the dominant factor — FX fees at 0.15% barely register. But on a traditional broker, FX fees add a meaningful second layer of erosion.
Over five years, those invisible losses compound to £1,500–£1,625 that simply evaporated between the company's payment and your account balance. That's money that could have been reinvested, compounding your returns.
To put that in perspective: £300 a year is roughly one share of many blue-chip stocks. Every year, you're effectively giving up the equivalent of an additional share — a share that would itself generate dividends, which would themselves be subject to the same deductions. It's a compounding drag that works against you silently.
And if those stocks are held in a GIA rather than an ISA, the picture gets even worse. You'd still lose the 15% to US withholding tax, but you'd also owe UK dividend tax on the gross dividend above the £500 dividend allowance. At the basic rate of 8.75% (rising to 10.75% from April 2026), the combined deductions can eat through more than 20% of your headline yield. ISA placement is clearly better for US stocks, but even the ISA can't avoid the withholding tax cost.
The Comparison That Changes Everything
Here's where the maths gets really interesting. Say you're comparing two stocks:
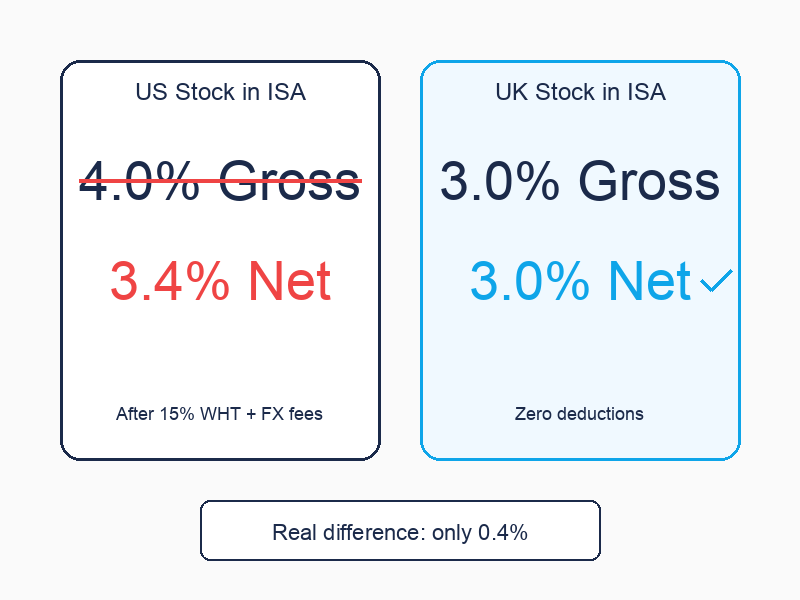
- US stock: 4.0% gross dividend yield
- UK stock: 3.0% gross dividend yield
On the surface, the US stock looks like the obvious winner — a full percentage point more income. Easy choice, right?
But run the numbers through the deduction chain:
- US stock in ISA: 4.0% gross → approximately 3.4% net (after 15% WHT + FX fees)
- UK stock in ISA: 3.0% gross → 3.0% net (zero withholding tax, zero FX conversion)
The real gap between these two stocks isn't 1.0 percentage point — it's only 0.4%. That completely changes the calculation.
This doesn't mean you should avoid US stocks entirely. There are strong reasons to hold them:
- Sector exposure: The FTSE 100 is heavily weighted towards financials, energy, and mining. US markets offer access to technology, healthcare, and consumer sectors that barely exist on the London Stock Exchange.
- Dividend growth: Many US companies have longer track records of consistently growing their dividends year after year.
- Currency diversification: Holding USD-denominated assets provides some natural hedge against sterling weakness.
But you should be making that decision with the real numbers, not the headline ones. A 0.4% yield advantage might still be worth it for the diversification benefits. A 1.0% advantage that doesn't actually exist shouldn't be the basis for your allocation strategy.
The same logic applies to dividend ETFs. An S&P 500 high-dividend ETF yielding 4.6% looks far more attractive than a FTSE 100 tracker at 3.5%. After withholding tax and FX fees, the US ETF delivers roughly 3.9% net — a real advantage of just 0.4% over the UK alternative, not the 1.1% the headline suggests. Whether that remaining gap justifies the geographic diversification is a decision worth making deliberately, rather than one driven by misleading numbers.
How to See Your True Yield
The core problem is visibility. Your broker shows you the gross yield. Your dividend notifications might show the US withholding tax line if you look carefully enough, but the FX fee? That's almost always baked into the exchange rate you receive, with no separate line item to flag it.
Most investors discover the gap by accident — they expect a certain amount in their account based on the gross yield, and the number that arrives is consistently lower. Some never notice at all.
Nestor calculates your true income automatically. Import your Trading212 portfolio and it identifies the country of domicile for each holding, applies the relevant withholding tax rate based on the UK's double taxation treaties, factors in your broker's FX fee structure, and shows you the net yield in pounds — the actual number that reaches your account.
Instead of that misleading 4.5% gross figure, you see the 3.82% you're actually receiving. And it shows you the total annual impact in pounds across your entire portfolio, so you can see exactly how much geography is costing you and decide whether the diversification trade-off is worth it.
You could do this with a spreadsheet, of course. But tracking withholding tax rates by country of domicile, applying the correct treaty rates, factoring in broker-specific FX fees, and updating it all quarterly as dividends arrive — that's the kind of tedious ongoing maintenance that most people start but few continue. Automation removes the friction and gives you the real numbers every time you open the app.
The One Thing to Remember
The dividend yield on your broker screen is not the dividend yield in your pocket.
For US stocks held in a UK ISA, expect to lose roughly 15–17% of the headline yield to withholding tax and FX fees combined. On a 4% gross yield, that means you're receiving approximately 3.3–3.4% net. That gap is permanent, it's not recoverable inside an ISA, and it matters more the larger your portfolio gets.
Knowing the cost doesn't mean avoiding US stocks. It means making allocation decisions with the full picture — comparing what you actually keep, not what the label says.