Most UK dividend investors have heard about the April 2026 tax increase. Two percentage points. And most have had the same reaction: two points is barely anything. Not worth worrying about.
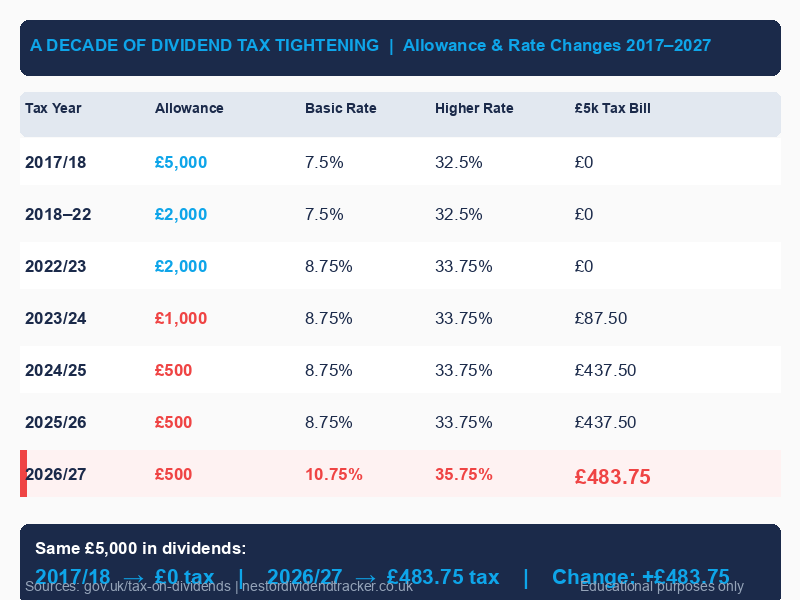
The reaction is understandable, but it misses the full picture. The two-point rate rise is the final layer of a squeeze that has been running for nearly a decade. In 2017, a UK investor with £5,000 in dividend income paid zero tax on it. From April 2026, that same investor hands over £484. Not because of April's rate change alone, but because the allowance shrank from £5,000 to £500 and the rate climbed from 7.5% to 10.75%. Two changes, moving in opposite directions, compressing the same income from every side.
This article goes through the full picture: what the new rates mean in real cash terms at basic and higher tax bands, why the net yield for higher-rate GIA investors now falls below many easy-access savings accounts, how the ISA advantage gap widens after April 6, and what the HMRC payment date rule means for dividends going ex-dividend this March. All of it grounded in verified numbers from HMRC's own published guidance.
Why higher-rate GIA investors need to look closely at net yield
The number that tends to stop higher-rate investors in their tracks is not the rate itself. It is what the rate leaves behind.
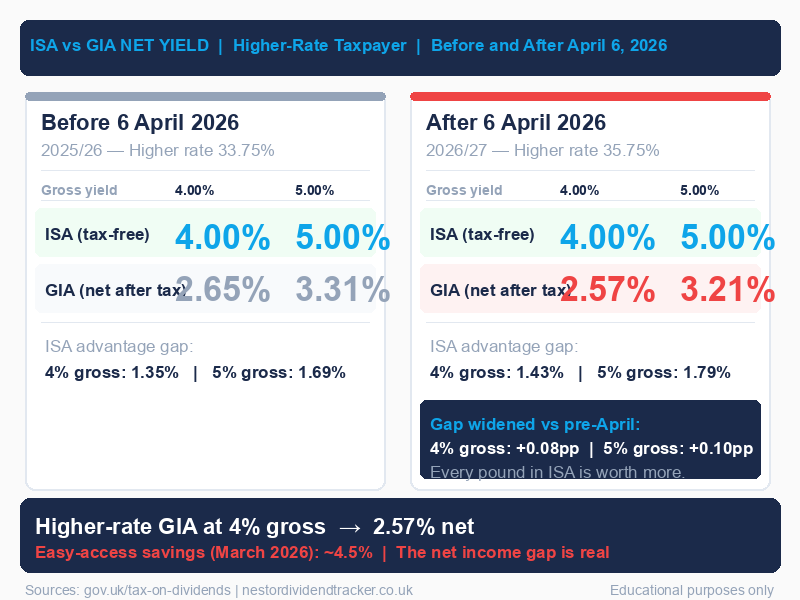
Take a UK stock with a 4% gross dividend yield, held in a General Investment Account (GIA), with all income above the £500 allowance. Before April 6, a higher-rate taxpayer keeps 2.65% net after dividend tax at 33.75%. From April 6, at the new 35.75% rate, they keep 2.57%.
That is a net yield of 2.57%. Easy-access savings accounts in the UK were paying around 4.5% in March 2026. A higher-rate investor with UK dividend stocks in a GIA is netting income below what a cash savings account generates, before accounting for any growth potential in the equities.
The point is not that equities are a bad choice. Growth, inflation protection, and dividend increases over time are the case for equities, and those matter. But if the reason you hold a particular stock is the income, the net income after tax is the number that counts, and 2.57% is the number worth knowing.
Scale it up to a 5% gross yield and the picture is similar. A higher-rate taxpayer in a GIA keeps 3.21% net after April 6. The ISA keeps all 5.00%. The income gap between the two wrappers for the same holding is 1.79 percentage points. Before April 6 that gap was 1.69 points. It widened.
| Gross yield | ISA net yield | GIA net yield (before April 6) | GIA net yield (after April 6) | ISA advantage gap (post-April) |
|---|---|---|---|---|
| 4.00% | 4.00% | 2.65% | 2.57% | 1.43pp |
| 5.00% | 5.00% | 3.31% | 3.21% | 1.79pp |
Higher-rate taxpayer. GIA income fully above the £500 annual allowance. Sources: HMRC dividend tax rates, gov.uk/tax-on-dividends
For basic-rate investors the numbers are different but the direction is the same. A 4% gross yield becomes 3.57% net after April 6 (down from 3.65%). A 5% gross yield becomes 4.47% net (down from 4.56%). Smaller gaps, but still a permanent annual reduction in what you keep.
But the net yield comparison is only the first part of the story. The second part is what happens when you trace the same £5,000 in dividends back to where this started.
From £0 to £484: the decade that squeezed both sides at once
The April 2026 rate change does not stand alone. It is the latest step in a decade of tightening that has moved the tax burden on ordinary dividend income from nothing to nearly five hundred pounds. Understanding that journey matters because it changes how you read the April change.
In 2017/18, the UK dividend allowance was £5,000. That meant the first £5,000 of dividend income each year was tax-free regardless of your tax band. The basic dividend tax rate at the time was 7.5%. So if you had exactly £5,000 in dividends that year, you paid £0. Every penny landed inside the allowance.
The allowance then fell: to £2,000 from 2018/19, staying there until 2022/23. In April 2022 the rates went up by 1.25 percentage points (tied to the Health and Social Care Levy). That levy was later scrapped by Chancellor Hunt, but the dividend rates were not reversed. They stayed at 8.75% basic and 33.75% higher. Then the allowance dropped again: £1,000 for 2023/24, and £500 from 2024/25 onwards. April 2026 adds another two points to the basic and higher rates.
The result for a basic-rate taxpayer with exactly £5,000 in annual dividends:
| Tax year | Allowance | Basic rate | Taxable income | Tax bill |
|---|---|---|---|---|
| 2017/18 | £5,000 | 7.5% | £0 | £0 |
| 2022/23 | £2,000 | 8.75% | £3,000 | £262.50 |
| 2025/26 | £500 | 8.75% | £4,500 | £393.75 |
| 2026/27 | £500 | 10.75% | £4,500 | £483.75 |
Sources: gov.uk/tax-on-dividends (allowance history and rate history). Tax bills verified independently.
The same income. The same investor. The same stocks. A tax bill that went from nothing to £483.75.
When you see the April rate rise as the final layer on top of that history, two percentage points stops looking like a rounding error. The headline change is modest. The accumulated effect is not.
The other thing the decade history shows is that the pattern has been consistent. Both levers have moved against dividend investors simultaneously. There is no obvious reason to assume either lever reverses in the near term. What the ISA does, by contrast, is place your dividend income outside the reach of both levers. The allowance changes do not affect ISA income. The rate changes do not affect ISA income. The combination makes the ISA increasingly valuable with each step of the squeeze.
What the new rates cost in cash terms
For most investors the abstract rate discussion matters less than the concrete number. Here is what the April 2026 increase costs at different levels of taxable dividend income, for basic-rate and higher-rate taxpayers.
Taxable dividend income means dividends received in a GIA above the £500 annual allowance. Dividends inside an ISA are always tax-free.
Basic-rate taxpayer (rate rises from 8.75% to 10.75%):
| Taxable dividends | 2025/26 tax (8.75%) | 2026/27 tax (10.75%) | Increase |
|---|---|---|---|
| £1,000 | £87.50 | £107.50 | +£20 |
| £3,000 | £262.50 | £322.50 | +£60 |
| £5,000 | £437.50 | £537.50 | +£100 |
Higher-rate taxpayer (rate rises from 33.75% to 35.75%):
| Taxable dividends | 2025/26 tax (33.75%) | 2026/27 tax (35.75%) | Increase |
|---|---|---|---|
| £1,000 | £337.50 | £357.50 | +£20 |
| £3,000 | £1,012.50 | £1,072.50 | +£60 |
| £5,000 | £1,687.50 | £1,787.50 | +£100 |
Sources: gov.uk/tax-on-dividends. All figures independently verified.
A few things are worth noting here. The cash increase is identical at both bands for the same income level: £20 more on £1,000, £60 on £3,000, £100 on £5,000. The rate change is symmetric.
But the starting tax burden is not. A higher-rate taxpayer on £5,000 in taxable dividends is paying £1,787.50 from April 2026. A basic-rate taxpayer is paying £537.50 on the same income. The rate increase of £100 means something different on a £538 base than it does on a £1,788 base.
For higher-rate taxpayers, the scale of the existing burden is the main argument for ISA maximisation. The rate change makes a bad situation fractionally worse. The size of the total bill is the reason to act before it accumulates further.
The ISA shield, and why the April 5 deadline matters
The ISA has been the consistent answer to a decade of tightening, and the April rate rise makes that answer more compelling.
The annual ISA allowance is £20,000 for 2025/26. Dividends earned inside an ISA are entirely tax-free and do not count toward the £500 annual dividend allowance. That treatment is unchanged and unaffected by the April 2026 rate rise. While GIA rates climb, ISA income stays at zero.
The deadline is April 5. This year's £20,000 allowance cannot be carried forward. Whatever you do not use by midnight on April 5 is gone permanently.
The ISA advantage calculation is simple. At a 5% yield, a higher-rate taxpayer keeps 5.00% inside an ISA. In a GIA after April 6, they keep 3.21%. The annual income gap on a £50,000 holding is roughly £900 per year: £2,500 inside an ISA versus £1,605 in a GIA. That gap repeats every year, permanently, for as long as the holding stays in the GIA at current or higher tax rates.
If you have unused ISA allowance and cash sitting outside an ISA, using it before April 5 permanently shelters that capital from future GIA rate changes. You do not know what rates will be in 2028 or 2030. But you do know that ISA income has been zero through every change in the decade above, and that the allowance is frozen at £20,000 until at least 2031.
There is also the Bed and ISA option for GIA holdings you want to keep long-term. This involves selling shares in your GIA, contributing the proceeds to your ISA, and repurchasing the same shares inside the wrapper. The process has real costs: any gains realised on sale are subject to Capital Gains Tax (£3,000 annual exempt amount for 2025/26; rates of 18% for basic-rate and 24% for higher-rate taxpayers on shares, from October 2024 onwards). Buying UK shares inside the ISA also attracts 0.5% Stamp Duty Reserve Tax on the repurchase. The 30-day bed-and-breakfast anti-avoidance rule does not apply to ISA repurchases, because the ISA manager holds shares in a different legal capacity to the GIA (confirmed in HMRC Capital Gains Manual CG51560). The episode that covered this in detail was S1E10 on tax year boundaries.
Whether Bed and ISA makes sense depends on the gain in your holding versus the future annual tax saving. A holding near its purchase price has low entry costs. A holding with large unrealised gains requires a careful calculation before acting.
The core question is not whether the ISA is valuable. It clearly is. The question is how much of your annual £20,000 allowance you have used.
The payment date rule: which dividends get caught at the new rate
There is one more mechanism that affects the April boundary, and it catches investors off guard every year. HMRC taxes dividends based on the payment date, not the ex-dividend date. This is established in ITTOIA 2005 section 384(1) and confirmed in HMRC's Savings and Investment Manual (SAIM5020).
Most investors assume the ex-dividend date is the relevant one. A stock goes ex-dividend on March 20, so that dividend belongs in this tax year. That assumption is wrong.
What the ex-dividend date determines is who qualifies for the payment: if you own the shares before the ex-date, you are entitled to the dividend. But HMRC's tax year assignment runs from the payment date, the date the money is actually transferred to shareholders. And for large UK companies, the gap between ex-date and payment date is typically four to seven weeks. A March ex-date with an April or May payment date is common, not exceptional.
This year that gap carries a direct cost. Dividends paid on or after April 6 fall into the 2026/27 tax year at the new, higher rates. It does not matter that the stock went ex-dividend in March or that you felt entitled to that income before the April deadline. HMRC's clock starts on payment day.
The practical implication: if you hold GIA stocks with dividends going ex in late February or March, check the payment dates rather than the ex-dates. Payment dates are published on company investor relations pages and on the London Stock Exchange announcement feed. For any payment landing on or after April 6, the new rates apply. That is information you can find in advance, before the payment arrives.
The S1E10 article on the tax year boundary covers this rule in more detail with two FTSE 100 examples where the ex-date and payment date straddle April 5.
How to see this in your portfolio
Most broker platforms show you dividend income in calendar-year totals: January to December. That is not the number HMRC uses. Your dividend allowance resets April 6 each year. The relevant figure for tax purposes is what you have received from April 6 to today, in your GIA only.
Nestor tracks dividends by UK tax year, so you can see your April-to-now GIA income against the current £500 allowance rather than a calendar-year total. For each GIA holding, it applies the tax rate relevant to your band, so the income figure shown is net of dividend tax rather than gross yield. The difference between the gross yield your broker shows and the net yield you actually keep is the gap this episode is about.
For the payment date question, Nestor shows upcoming payment dates for your portfolio holdings alongside the ex-dividend dates, so you can see which side of the April 5 boundary each upcoming payment lands on without searching each company's investor relations page separately.
The practical value is knowing your position now, while there is still time to consider whether to top up your ISA, look at Bed and ISA for any near-cost-basis GIA holdings, or simply make a note of which upcoming payments land in 2026/27 at the new rates rather than 2025/26 at the old ones.
The one thing to remember
You came to this article probably thinking that two percentage points was barely worth your attention. A rounding error on an already imperfect investment.
It is not quite that simple. The rate rise is the final layer of a decade in which both levers moved against GIA dividend investors simultaneously: the allowance fell from £5,000 to £500, and the rate climbed from 7.5% to 10.75%. The April change is modest on its own. In context, it lands on top of a tax burden that already looks nothing like the one investors were managing ten years ago.
The ISA has not changed through any of it. Same allowance, same zero tax rate, same April 5 deadline. Every year you fully use your ISA allowance is a year you permanently shelter £20,000 from whatever the GIA rate happens to be next.
The deadline is April 5. After that, this year's allowance is gone.