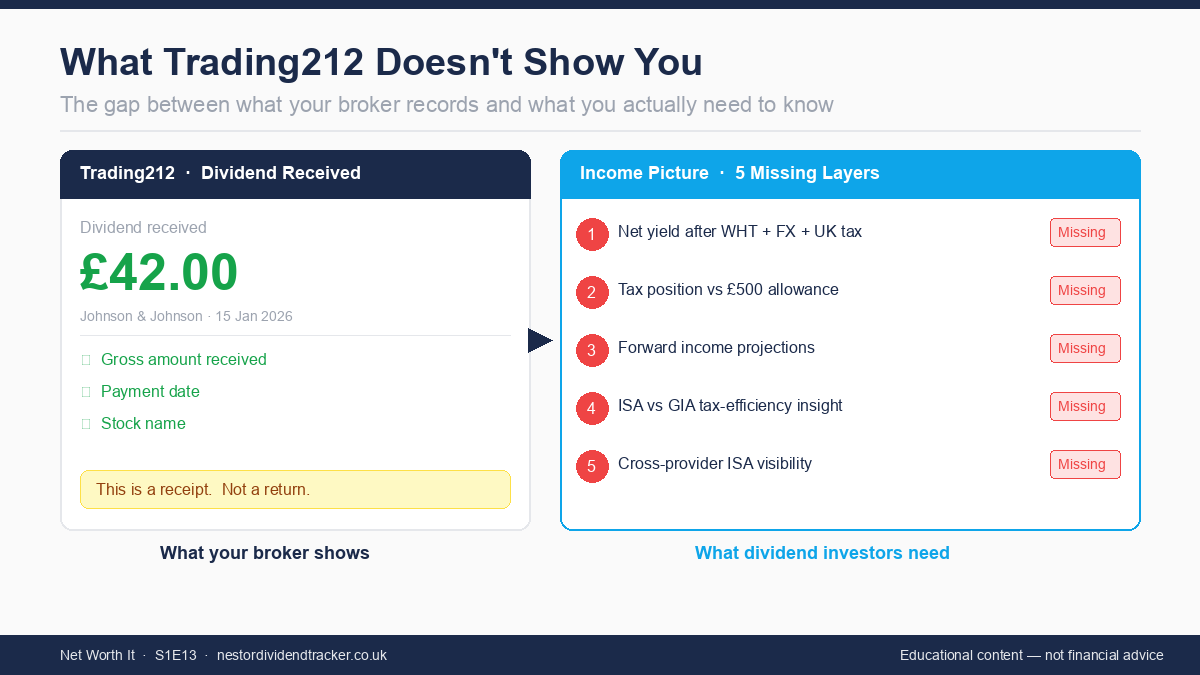
Every time a dividend lands in your account, Trading212 shows you a number. A pound amount. The money that arrived. After twelve episodes of learning about withholding tax, FX drag, the £500 allowance, and the mechanics of how dividends are actually taxed, you might assume your broker is tracking all of it.
It isn't. The number on your screen is a receipt. It tells you a payment arrived. It does not tell you what that payment represents as a return on your investment, where you stand on your tax position, or what's coming next. The entire calculation chain that determines what you actually keep — withholding tax, currency conversion, UK dividend tax, cumulative allowance usage — sits entirely outside your broker's display.
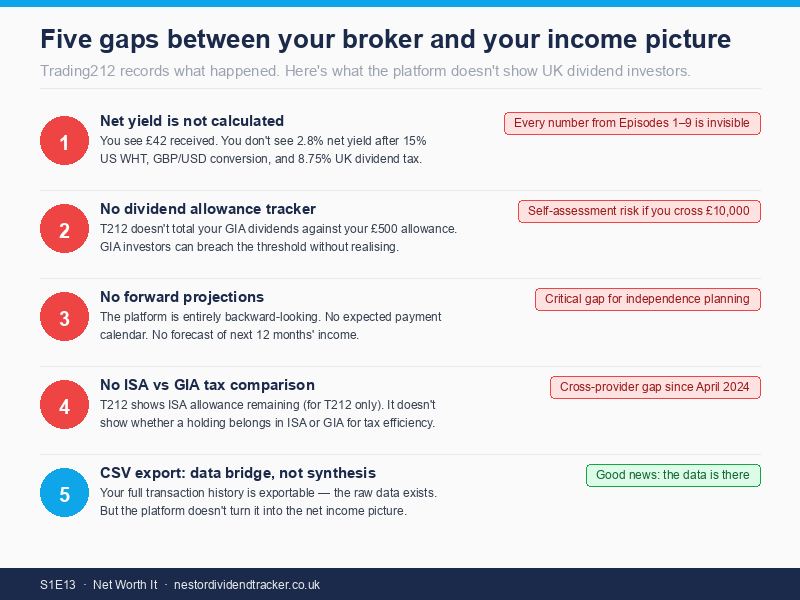
This article maps five specific gaps between what Trading212 shows and what UK dividend investors need. It also covers the self-assessment mechanics GIA holders must understand, a worked calculation showing how far gross and net yield can diverge, and how the platform's CSV export acts as a data bridge for investors who want to do the maths themselves.
Your tax position is invisible on the platform — and the consequences matter
Of the five gaps, this one has the most direct financial consequences. And it catches people who think they're on top of their finances.
Trading212 records every dividend that lands in your general investment account (GIA). It does not add them up against your £500 dividend allowance. There is no running total, no indicator that you've used £340 of your £500, no flag when you cross the threshold. If you hold a handful of dividend-paying stocks in a GIA and you're not tracking manually, you have no way of knowing your tax position from the broker screen alone.
The £500 figure is the annual dividend allowance for 2025/26. Dividend income above that amount is taxable: 8.75% for basic-rate taxpayers and 33.75% for higher-rate taxpayers in the current tax year, rising to 10.75% and 35.75% from April 6, 2026. Most investors know the allowance exists. Fewer know their exact position relative to it at any given point in the tax year.
What happens if you miss it? The answer depends on the amount:
| Dividend income in GIA | HMRC process |
|---|---|
| Up to £500 | Within allowance — no tax owed |
| £501 to £10,000 | HMRC typically collects via PAYE code adjustment or Simple Assessment |
| Above £10,000 | Full self-assessment return required |
If your total GIA dividend income crosses £10,000, you need to file a self-assessment return. If it's your first time filing, you must register with HMRC by October 5 following the end of the tax year — miss that and you're already late before the January 31 filing deadline even arrives.
The gap isn't that Trading212 has done something wrong. It's that the platform is designed to record what happened, not to track your tax position. Those are different jobs. For GIA investors, not knowing the difference is expensive.
But the tax position gap, as consequential as it is, has a counterpart that catches almost everyone, including investors who are entirely inside an ISA.
The yield your broker shows is not the yield you actually earned
This is the gap that sits underneath every number on your broker screen. And it applies whether you hold stocks in an ISA or a GIA.
When Trading212 shows you a dividend receipt, it shows the amount that landed in your account. What it does not show is what that payment represents as a yield on your investment after the deductions that happened before it arrived, or the tax that applies after.
Take a concrete example. Say you hold a US-listed stock in a GIA, bought for £1,000, with a 4.5% gross dividend yield. In a year, that stock would notionally pay £45 in dividends. Here is what actually happens to that money:
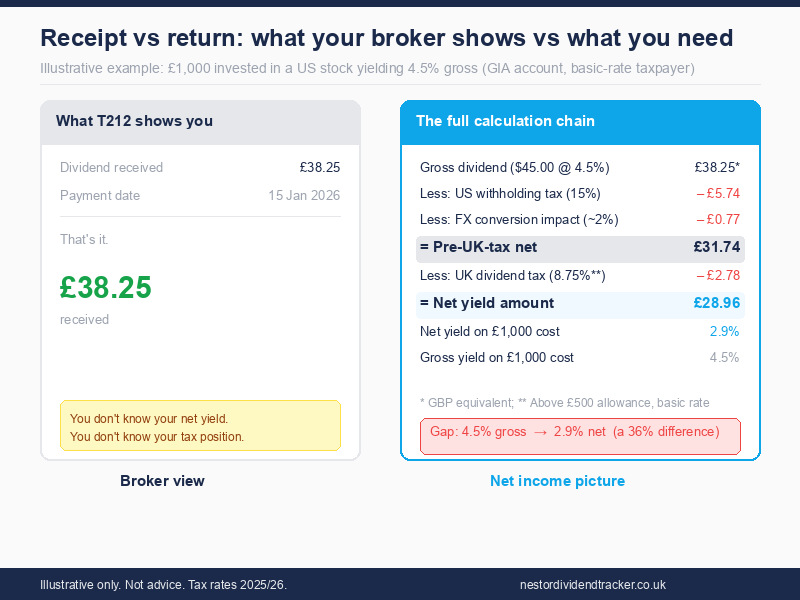
The US company pays a gross dividend. Before it reaches your account, 15% is deducted as US withholding tax (assuming you have a W-8BEN form on file with your broker; without it, the rate is 30%). The remaining amount is converted from USD to GBP at the prevailing exchange rate, which applies an FX conversion. What lands in your GIA account is less than the gross dividend, and it's already in GBP. If your total GIA dividends exceed the £500 allowance, UK dividend tax then applies on top at your marginal rate.
The number Trading212 shows, say £38.25, is after the US withholding tax and currency conversion, but before any UK tax calculation. There is no yield figure. There is no net-of-all-deductions calculation. You see a receipt. The return is something you would need to calculate yourself.
For a US stock in a GIA for a basic-rate taxpayer, the calculation chain looks like this:
| Step | Amount |
|---|---|
| Gross dividend (4.5% on £1,000) | £45.00 |
| Less: 15% US withholding tax | -£6.75 |
| Less: GBP/USD conversion impact (~2%) | -£0.77 |
| Pre-UK-tax net dividend | £37.48 |
| Less: 8.75% UK dividend tax (above £500 allowance) | -£3.28 |
| Net dividend received | £34.20 |
| Net yield on £1,000 cost | 3.4% |
The gross yield is 4.5%. The net yield, after the full calculation chain, is 3.4%. That gap matters more at scale. On a £50,000 portfolio, a 1.1 percentage point difference is £550 per year in income you thought you had but don't. On a £100,000 portfolio, it's £1,100. The bigger the portfolio, the more the invisible deductions compound.
Episodes one through nine of Net Worth It covered each element of this chain in detail: US withholding tax and the W-8BEN (S1E01), the dividend allowance mechanics (S1E02), FX drag on international holdings (S1E09). None of it appears on your broker screen.
That covers what's missing from your current holdings. The second-biggest planning gap is what's missing about the future.
No forward projections: your broker only looks backward
Trading212 is an excellent record-keeper of what happened. It shows every dividend that landed, the date, the amount. What it does not do is project forward.
There is no expected payment calendar. No "based on your current holdings, here is what you're projected to receive over the next twelve months." No estimate of how your current income trajectory compares to a financial independence target.
For investors tracking toward a specific income number (the kind of independence calculation we covered in episodes three, seven, and eleven), this matters. You can see total dividends received last year. You cannot see whether you're on track for next year.
The data required for forward projections is largely public. Dividend payment histories are available for most listed companies. Expected ex-dividend and payment dates follow predictable patterns. The information exists to estimate, within a reasonable margin, what a portfolio will pay over the next twelve months. But Trading212 is designed around trade execution and transaction recording, not income forecasting. Building forward projections for UK-specific dividend investors across all possible holdings isn't the platform's primary focus.
The practical consequence: investors who want to plan forward have to do it manually, building their own calendar from individual stock announcements, or use a separate tool.
There's also a related gap in the ISA wrapper, one that's become more relevant since April 2024.
ISA allowance: what Trading212 shows and what it can't
Trading212 does track your ISA allowance within the app. If you contribute £8,000 to your Trading212 ISA, it shows £12,000 remaining of the £20,000 annual limit. The Trading212 ISA has been a Flexible ISA since May 2024, which means withdrawals can be replaced within the same tax year without consuming further allowance, and the in-app tracker reflects that dynamically.
That's a genuine feature and worth naming clearly, because it's often miscounted as a gap.
The actual gap is two things. First: since April 2024, UK investors can subscribe to multiple ISAs of the same type in one tax year. If you contribute to a Trading212 ISA and also to a Hargreaves Lansdown ISA in the same tax year, Trading212 only knows about your Trading212 contributions. The remaining allowance it shows does not account for contributions at other providers. No UK broker shows a consolidated cross-provider view. And HMRC doesn't either. ISA managers report subscription data annually, typically by June after the tax year ends. Between April 6 and the following June, even HMRC's records are not real-time.
Second: there is no tool on the platform to tell you whether a specific holding would be more tax-efficient sitting inside your ISA versus your GIA. The framework for thinking about this was episode six: UK stocks with no withholding tax issue belong in the ISA primarily to shelter UK dividend tax; US stocks go in the ISA because it also shelters the withholding tax rate comparison. But that analysis is not surfaced anywhere in the app. You have to apply the framework yourself, stock by stock.
| ISA feature | What Trading212 shows |
|---|---|
| Remaining ISA allowance | Yes — for T212 contributions only |
| Cross-provider consolidated allowance | No — and HMRC can't show this in real-time either |
| Per-holding ISA vs GIA tax-efficiency | No — framework from S1E06 applies, but you apply it manually |
| Dividend allowance (£500) tracker for GIA | No — must track manually |
That's four distinct visibility gaps within the wrapper question alone. The good news is that all of the underlying data is there. It just requires a step to reach it.
The CSV export is where the data lives
Trading212 offers a CSV export of your full transaction history, accessible via Menu > History > Export. You can export four categories: Dividends, Orders, Transactions, and Interest. The dividend export covers up to 365 days per file, so investors wanting the full 2025/26 tax year (April 6, 2025 to April 5, 2026) need to generate two separate exports.
The dividend CSV is more detailed than many investors expect. It includes the information needed to calculate net yield and reconstruct your tax position. What the platform does not do is synthesise that raw data into a calculated net yield figure, a tax position summary, or a forward projection. The data exists. The calculation doesn't happen on the platform.
This is an important distinction. Trading212 isn't withholding information. The raw transaction record is exportable. The gap is between raw data and interpreted output. A lot of investors export the file and build their own spreadsheet to run the calculations. The work is doable; it's just not done for you.
The five gaps together create a consistent pattern: Trading212 records transactions with precision. It does not synthesise them into the income picture a UK dividend investor needs. These are two different jobs, and the platform is built for the first one.
How to see this in your portfolio
Nestor imports your Trading212 CSV export and calculates what the broker doesn't. It shows net yield after withholding tax, currency conversion, and UK dividend tax, so instead of "dividend received: £42.00," you see the actual percentage return on your cost basis in that holding, after every deduction in the chain.
On the tax position side, Nestor tracks your cumulative GIA dividends against the £500 allowance, distinguishing ISA and GIA income separately. This makes the allowance position visible throughout the year rather than at self-assessment time.
For forward planning, Nestor uses your recent payment history to project expected income over the next twelve months. This isn't a guarantee. Companies change dividends. But it gives you the directional picture your broker can't. If you're tracking toward a financial independence income target, you can see how current holdings compare to where you need to be.
The process starts with the CSV export: Menu > History > Export > Dividends, in Trading212. That file is the bridge between what your broker records and what you need to see.
The one thing to remember
You arrived at this article, and probably at your broker app, with a reasonable assumption: that the number showing when a dividend lands is your dividend income. It is, in the narrowest sense. It's the payment that arrived.
But it's a receipt, not a return. The yield that number represents, after withholding tax that was deducted before it reached you, after currency conversion, after UK tax on GIA income above £500, compared to what you originally invested, none of that is on the screen.
This isn't a flaw in Trading212. It is a scope decision. The platform executes trades, processes payments, and records transactions for approximately 3 million UK customers. It does those things extremely well. But trading and tracking are different jobs. A broker optimised for execution is not the same tool as one optimised for income planning.
Recognising that gap is what matters. The data exists. Your full transaction history is exportable and more detailed than most investors realise. What's missing is the calculation on top of that data: the synthesis that turns a receipt into a return, and a series of receipts into an income picture.
Once you know the data is there but not yet synthesised, you know what to go looking for.