You know your FIRE number. You know which account to put each stock in. The gap between where you are now and where you want to be still feels enormous. Most investors faced with that gap reach for the same instinct: find a higher yield, squeeze a bit more from the portfolio, close the distance that way.
That instinct is understandable. It is also, for most investors, pointing at the wrong lever.
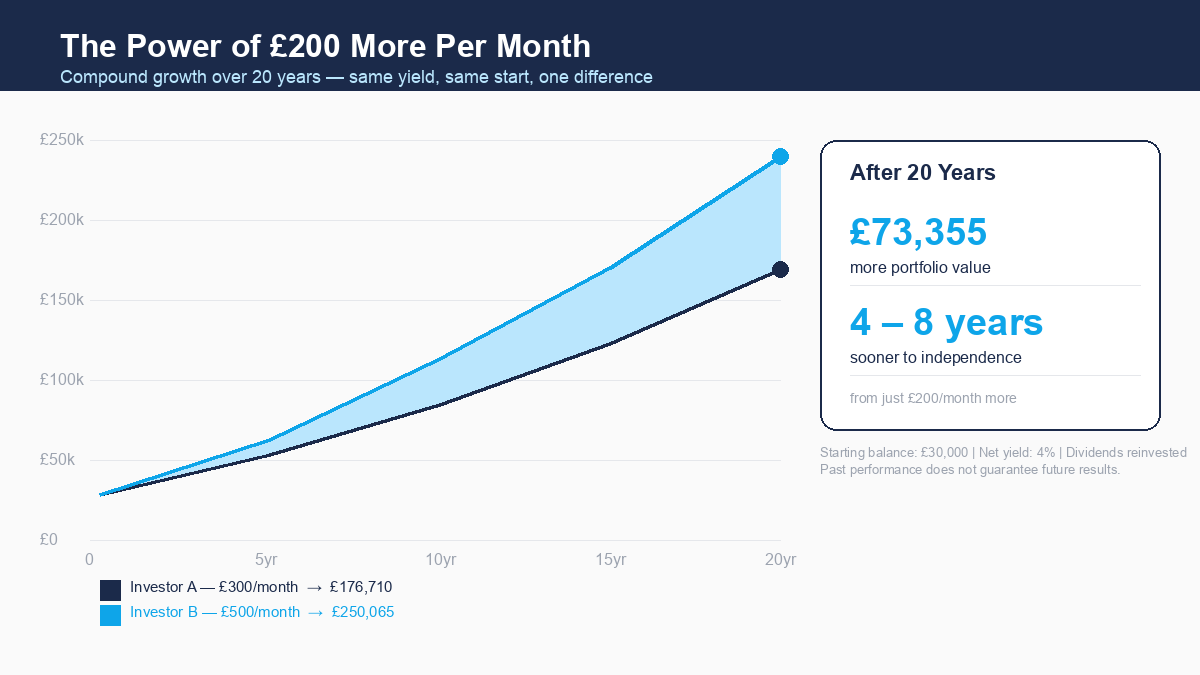
The maths is unambiguous. For a typical portfolio size, increasing your monthly contribution by £200 is eight times more powerful than finding an extra percentage point of yield. After 20 years, that same £200 per month — fully reinvested — produces a portfolio worth £73,000 more. And it brings your independence date forward by four to eight years, without picking a single new stock or taking on a single additional unit of risk.
This article unpacks exactly how that works, what the numbers look like at different time horizons, when yield optimisation does become the more powerful lever, and how to use the ISA deadline five weeks from now to lock in tax-free compounding that cannot be reversed.
Why Contribution Rate Beats Yield (Most of the Time)
The standard instinct when you want more income from your portfolio is to look for stocks with a higher yield. Move from 4% to 5% and your income jumps by 25%, right? That logic works in theory, but it ignores two important realities.
First, yield chasing introduces risk. Stocks with unusually high yields often carry that premium for a reason — elevated payout ratios, sector headwinds, or market scepticism about dividend sustainability. Episode 4 of this series covered the yield trap in detail. Reaching for an extra 1% of yield by moving down the quality ladder is not a free upgrade.
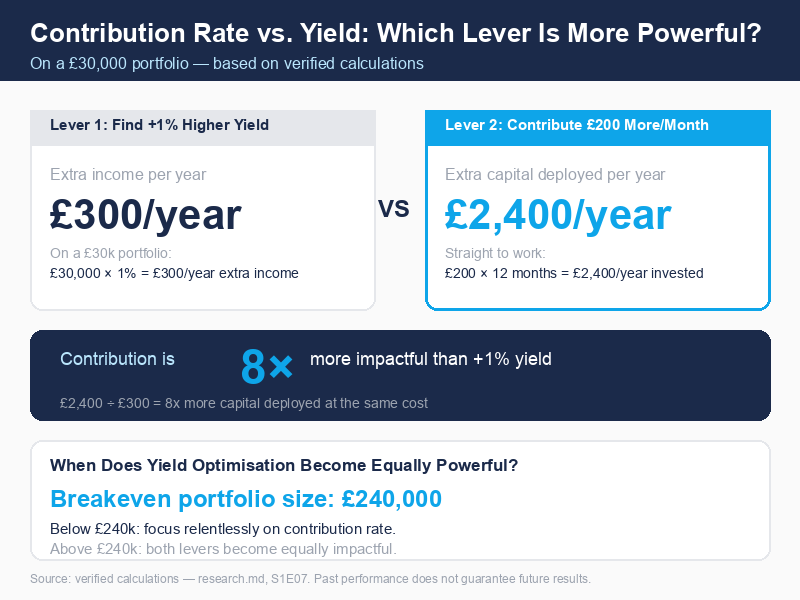
Second, and more fundamentally: the yield lever is simply much weaker than most investors realise at typical portfolio sizes. Consider a £30,000 portfolio — a realistic figure for someone a few years into their investing journey. An extra 1% of yield on that portfolio generates £300 more per year. That is it. Three hundred pounds.
Now consider what happens if, instead of hunting for a higher-yield stock, you find £200 more per month to contribute. Over one year, that is £2,400 more capital being deployed. Eight times the annual impact. Not from discovering a hidden gem or accepting more risk — simply from directing more of your income toward the portfolio.
The ratio is straightforward: +1% yield on £30k = £300/year. +£200/month = £2,400/year. The contribution lever wins by a factor of eight.
This ratio does not hold forever. As your portfolio grows, the yield lever grows with it — because a larger base means a given yield percentage represents more pounds of income. The exact breakeven point, where finding an extra 1% of yield becomes equally as impactful as contributing £200 more per month, is £240,000 in portfolio value (£240,000 × 1% = £2,400/year). Below that threshold, contribution is overwhelmingly the dominant variable. Above it, both levers deserve attention.
For most listeners currently building their portfolio — whether that is a £20,000 ISA or a £60,000 GIA and ISA combined — the contribution rate is the number worth obsessing about.
The Numbers: What Two Investors' Portfolios Actually Look Like
Let's make this concrete. Two investors. Identical starting portfolio of £30,000. Identical net dividend yield of 4%, fully reinvested. Identical stocks, same account, same tax wrapper. The one and only difference: Investor A contributes £300 per month. Investor B contributes £500 per month — exactly £200 more.
All figures below use the standard compound growth formula applied with monthly compounding. They are illustrative scenarios based on consistent returns and full reinvestment. Past performance does not guarantee future results.
At the 4% Net Yield Assumption (Conservative — No Dividend Growth)
This scenario treats the 4% net yield as the entire source of return — no capital appreciation, no dividend growth factored in. It is the most conservative reasonable assumption.
| Milestone | Investor A (£300/mo) | Investor B (£500/mo) | Portfolio Difference | Extra Contributed | Compounding Multiplier |
|---|---|---|---|---|---|
| 10 years | £88,900 | £118,350 | £29,450 | £24,000 | 1.23× |
| 15 years | £128,436 | £177,654 | £49,218 | £36,000 | 1.37× |
| 20 years | £176,710 | £250,065 | £73,355 | £48,000 | 1.53× |
The compounding multiplier column tells the real story. Over ten years, the extra £24,000 contributed (£200 × 12 × 10) has generated £29,450 of portfolio difference — the maths is already outpacing the raw contribution. By twenty years, every £200 of extra monthly contribution has grown into £2.17 more of real portfolio value.
Notice something important here: after twenty years, Investor B has not just recouped the extra £48,000 they put in. They have generated £73,355 of additional wealth from that £48,000. The difference between what was put in and what grew in portfolio value — £25,355 — is pure compound growth working on their behalf.
At the 7% Total Return Assumption (More Realistic for Dividend Growers)
The 4% yield-only scenario is conservative because it assumes no dividend growth whatsoever. In practice, a portfolio of dividend-growing companies — the kind that have increased their payouts year after year — has historically delivered total returns in the 6–8% range, combining yield with dividend growth.
If we model a 7% total return (4% net yield plus 3% annual dividend growth, compounding):
| Milestone | Investor A (£300/mo) | Investor B (£500/mo) | Portfolio Difference | Extra Contributed | Compounding Multiplier |
|---|---|---|---|---|---|
| 10 years | £112,215 | £146,832 | £34,617 | £24,000 | 1.44× |
| 15 years | £180,557 | £243,950 | £63,392 | £36,000 | 1.76× |
| 20 years | £277,440 | £381,625 | £104,185 | £48,000 | 2.17× |
At the 7% scenario, the twenty-year portfolio gap exceeds £104,000 — over £100,000 of additional wealth generated from £48,000 of extra contributions. The compounding multiplier reaches 2.17×: every pound of that extra £200 per month becomes £2.17 in real portfolio value over twenty years.
This is the compounding loop at full power. Each extra pound contributed earns dividends. Those dividends get reinvested. The reinvested dividends earn more dividends. And if those companies are growing their payouts, each reinvestment also captures a higher yield on the original cost — compounding the compounding.
How Many Years of Freedom Does £200 Buy You?
The portfolio size comparison is striking. But the number that tends to shift perspective most decisively is the timeline.
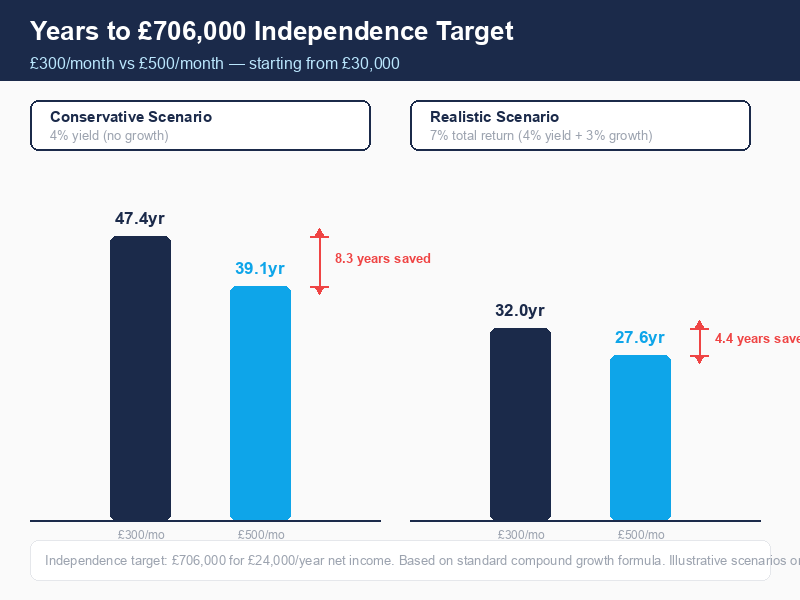
Let's use the independence target established in Episode 3 — £706,000 in a combined ISA and US stocks portfolio, sufficient to generate £24,000 per year in net dividends at approximately 3.4% net yield. That figure was independently calculated based on the tax treatment of dividend income across different portfolio compositions and wrappers. It is a specific, grounded target, not a round number.
Starting from £30,000, here is how long each investor takes to reach it:
| Total Return Assumption | Investor A (£300/mo) | Investor B (£500/mo) | Years of Freedom Gained |
|---|---|---|---|
| 4% yield only (conservative) | 47.4 years | 39.1 years | 8.3 years |
| 5% total return | 40.8 years | 34.2 years | 6.6 years |
| 7% total return (realistic) | 32.0 years | 27.6 years | 4.4 years |
The range is four to eight years of financial independence brought forward. From a single decision about monthly contributions. Not from timing the market, not from stock-picking, not from accepting leverage or concentrated risk.
To frame it differently: if you start investing at 30 and your realistic scenario puts you on a 32-year journey to independence, Investor B gets there at 57.6 rather than 62. That is not a small difference. That is your early 60s versus your late 50s. That is a decade-long period of your healthiest retirement years potentially reclaimed.
What If You Cannot Find £200?
This is the right question to ask, and it deserves a direct answer.
The £200 figure is illustrative — it is not a minimum, not a threshold, and not a judgment. It is simply the number that makes the scale of the compounding effect visible. The same mathematical principle applies at every level of contribution increase.
An extra £50 per month — fully reinvested over 20 years at 4% — generates roughly £18,000 of additional portfolio value versus not increasing contributions at all. An extra £100 per month generates approximately £36,000 more. The direction matters far more than the exact amount. Even a £20 increase, sustained for years and compounded, creates meaningful distance.
Beyond regular monthly increases, there are other routes to the same destination. Irregular contributions — annual bonuses, tax refunds, money released from unwinding a direct debit you forgot about — all add capital that the compound growth engine can put to work.
Vanguard research from 2023 found that investing a lump sum immediately tends to outperform drip-feeding it into the market in approximately 68% of historical scenarios across UK, US, and Australian markets. The reason is straightforward: markets trend upward over time, so money invested earlier generally has more time to compound. When you receive a bonus or tax refund, there is a reasonable case for deploying it as a lump sum rather than trickling it in month by month.
The core insight is not the specific £200 number. It is that your contribution rate is the one variable you fully control. Your dividend yield depends on company decisions and market conditions. Your tax treatment depends on government policy. Your broker fees are set by a third party. But how much you invest each month is a decision entirely within your authority. That asymmetry — between what you can control and what you cannot — is why this lever deserves the most attention.
The ISA Deadline Makes This Especially Timely
There is a real-world context layer sitting over all of this: the ISA deadline of April 5, 2026, which is approximately five weeks from the date of this article's publication.
The UK ISA allowance is £20,000 per tax year. That allowance does not carry forward. If you reach April 6 without having used your full allowance, that year's unused portion is permanently gone. You cannot add it to next year's £20,000.
The scale of unused allowance in the UK is worth understanding. According to HMRC's annual savings statistics for 2023/24, there were approximately 15 million adult ISA accounts, which subscribed a total of £103 billion — an average of around £6,867 per account. With a £20,000 annual allowance, that average represents just over a third of the maximum. And only 22.7% of ISA subscribers in 2022/23 actually used their full allowance (the most recent year for which HMRC has published this specific breakdown).
Which means the overwhelming majority of UK investors — even those active enough to hold an ISA — are leaving significant allowance unused every year.
The urgency is sharpened further by what happens on April 6, 2026: dividend tax rates increase. The basic rate moves from 8.75% to 10.75%. The higher rate from 33.75% to 35.75%. Every pound of dividend income generated inside an ISA wrapper is unaffected by this change — it remains tax-free regardless. But every pound left outside the ISA wrapper will face a higher tax bill from that date forward.
A contribution made now, before April 5, secures another year of tax-free compound growth. Given the compounding dynamics shown above, the timing of when a pound enters the ISA wrapper matters — earlier contributions have more time to compound tax-free. A missed year of ISA allowance is not just a missed year. It is also the tax-free compounding on every year after that which the contribution would have generated.
This is not a pressure tactic — it is a factual observation about how the ISA rules work. The deadline is April 5. The allowance does not carry over. Dividend tax rates rise on April 6.
How to Model This for Your Own Portfolio
The examples in this article use a £30,000 starting balance and a 4% net yield because those are concrete, realistic, and easy to track. Your situation will differ. You might have £8,000 or £180,000. Your yield might be 3.2% or 5.4%. You might be splitting contributions between ISA and GIA. The exact numbers change; the compounding dynamic does not.
Nestor's independence settings let you model this against your actual portfolio rather than a hypothetical scenario. You can adjust your monthly contribution assumption directly in the app and watch the projected timeline to your independence target respond in real time. Want to see what £50 more per month looks like versus £200 more? You can compare both, applied against your actual portfolio balance, your actual dividend yield data, and your specific tax situation.
The app does not tell you what to do — it shows you what the maths produces under the assumptions you choose to explore. Your portfolio, your timeline, your scenario. No hypothetical £30,000 required.
The One Thing to Remember
Your contribution rate is the variable you fully control. For most investors at typical portfolio sizes, a consistent increase in how much you put in each month compounds into years of financial independence gained — not just months, and not just a modestly larger portfolio balance.
The yield you can achieve depends on markets, companies, and conditions outside your control. The amount you invest each month is entirely yours to decide.
Pick the lever that is actually yours to pull.