Most UK dividend investors set themselves one target: the FIRE number. For a well-managed ISA with US dividend stocks, episode S1E03 of Net Worth It put that number at around £706,000, the portfolio size needed to generate £2,000 a month in net income. You stare at that figure, compare it to your current balance, and do the obvious calculation: this is going to take forever.
But here's what the maths actually shows. The hardest stretch of the journey isn't the last bit to £706,000. It's the first bit. The time between each milestone shortens as your portfolio grows, because compounding is doing more and more of the work. And the real problem with watching portfolio value isn't that the number is depressing. It's that it's the wrong number entirely.
This article walks through why net dividend income is the metric that tracks your independence journey, how real UK bills map to each income milestone, and why the early milestones, though slow, prove the machine is working before it accelerates.
Portfolio value is a noisy signal, and it's pointing the wrong way
Open your broker app on a bad week and your portfolio is down. Open it after a week of positive sentiment and it's back up. Neither movement tells you whether your dividend income engine is actually building.
Portfolio value moves with market sentiment, with interest rates, with whether a company you've never heard of had a bad earnings call. It responds to things that have nothing to do with your actual progress toward financial independence. A quality holding can see its share price fall 20% while still paying and growing its dividend. Conversely, a company can look fine on price while quietly preparing to cut. Price is a lagging, noisy signal for the thing you actually care about.
Net dividend income is different. For a diversified portfolio of quality holdings, it tends to move in one direction: up. You add shares, dividends get reinvested, the income compounds. There are setbacks. 2020 showed that even solid UK dividend payers cut distributions when extraordinary circumstances arrive. But income is less volatile than price, and it maps directly to financial independence in a way that portfolio value doesn't.
The mental shift matters too. Research in behavioural finance shows people stay motivated on long-term goals when they have nearby intermediate targets to hit. When your goal is "reach £706,000," the feedback loop is painfully slow. When your goal is "cover my broadband bill," it's within reach.
How milestones accelerate (the part that surprises everyone)
Here's the counterintuitive property of compounding that most people don't discover until they're well into the journey: the time between milestones shortens as you climb.
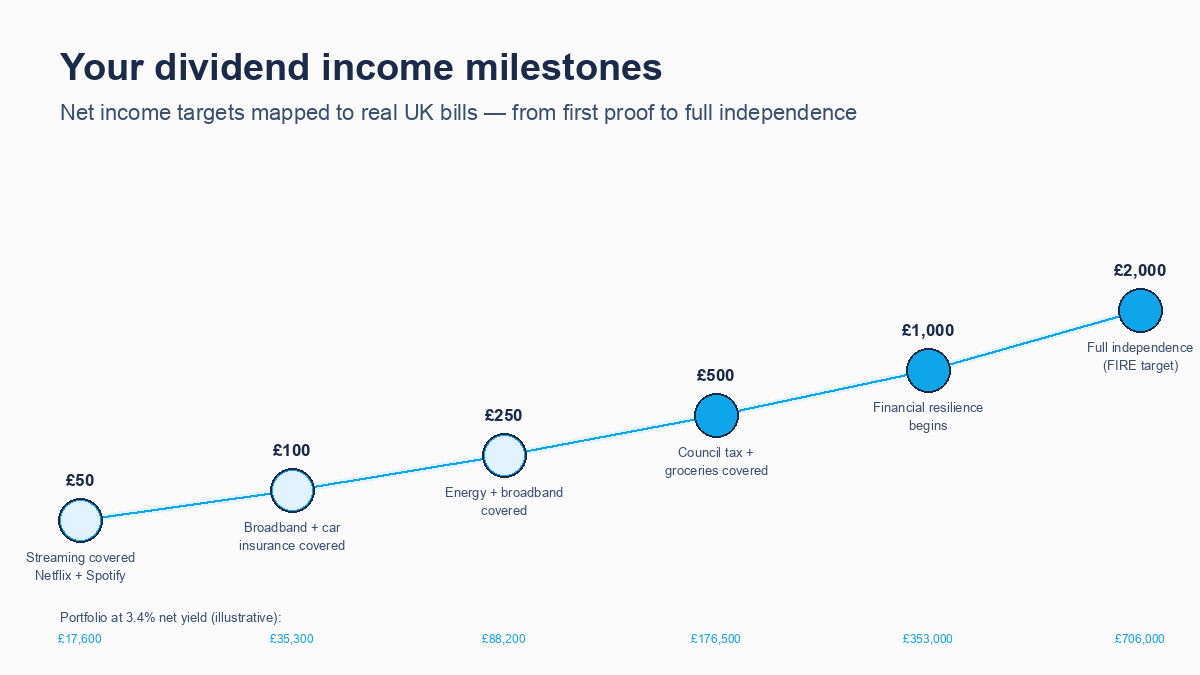
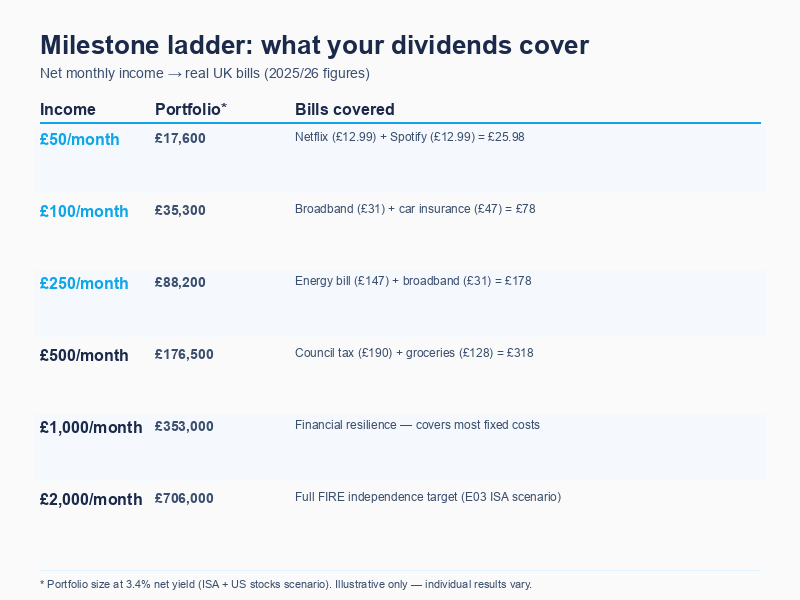
At a 3.4% net yield (the figure from the ISA with US dividend stocks scenario in episode S1E03), each income level requires the following portfolio size:
| Net monthly income | Portfolio needed | What it covers |
|---|---|---|
| £50/month | ~£17,600 | Netflix + Spotify (~£26/month) |
| £100/month | ~£35,300 | Broadband + car insurance (~£78/month) |
| £250/month | ~£88,200 | Energy bill (~£147/month) + broadband |
| £500/month | ~£176,500 | Council tax + groceries for one |
| £1,000/month | ~£353,000 | Real financial resilience begins |
| £2,000/month | ~£706,000 | Full independence (the FIRE target) |
Illustrative only. Based on 3.4% net yield (ISA + US dividend stocks scenario, E03 registry). Individual timelines depend on your starting portfolio, contribution rate, actual yield, tax wrapper, and market conditions.
The portfolio doubles at each step. You might expect the time to double too, and in the early stages that's roughly true, because your contributions are doing most of the work. But that's the point where most people give up, because the early stages feel like treacle.
From £35,300 to £176,500 (the £100/month to £500/month step), the portfolio needs to grow by £141,200. At that scale, a 3.4% net yield generates roughly £1,200/year in dividends for reinvestment, so the portfolio starts building itself alongside your contributions. From £353,000 to £706,000 (the £1,000 to £2,000 step), the portfolio generates about £12,000/year in reinvestable dividends. The compounding has become a serious contributor to growth.
Episode S1E07 showed that adding just £200/month to contributions shaves 4.4 to 8.3 years off the timeline to £706,000. That acceleration effect compounds across every milestone, not just the final one. The machine isn't warming up. It's already running. It just runs faster at every stage.
There is also a psychological dimension to the acceleration. Behavioural finance research on the goal gradient effect (most associated with Kivetz, Urminsky, and Zheng's 2006 work in the Journal of Marketing Research) shows that motivation intensifies as people approach an intermediate goal. You move faster when you can see the next milestone clearly. This is part of why the milestone framework works in practice: each income target you hit increases your momentum toward the next one, independent of the portfolio maths.
The implication is straightforward. The slower you start, the more important the early milestones are. Getting to £50/month net dividends is worth celebrating not because the amount is large, but because crossing it activates the motivation loop for the next step.
The income ladder mapped to real UK bills
Abstract income targets feel hollow. "£250 a month in dividends" doesn't feel real until you tie it to something concrete. Here's how the milestones map to actual UK household bills, using current data.
£50/month — proof the machine is real
Netflix Standard is £12.99/month. Spotify Premium is £12.99/month. Combined: £25.98. Your first £50/month in net dividends pays both streaming subscriptions and has change left over. This is the milestone that proves your portfolio is generating real income, not just paper value. The bill is paid. No labour required.
£100/month — the first utilities covered
Average UK broadband runs £30.66/month (Ofcom, Q2 2025 data). Average UK car insurance is £47/month (ABI 2025 annual average). Together that's £77.66/month. At £100/month in net dividends, you're covering broadband and car insurance with room to spare. Two genuinely useful bills, paid by income your money generates while you're at work.
£250/month — energy covered
The Ofgem price cap for Q1 2026 puts the average UK household energy bill at £1,758/year, about £147/month. Add broadband at £31/month and your £250/month covers energy and broadband. For most households, this is one of the largest recurring bills. Having dividends cover it changes the texture of the month.
£500/month — the real-world slice
Average Band D council tax in England for 2025/26 is £2,280/year, or around £190/month. ONS Family Spending data puts average grocery spend for one person at £29.66/week (roughly £128/month), though grocery prices have risen since that 2022/23 survey, so treat it as a floor rather than a ceiling. At £500/month in net dividends, council tax and groceries for one person are covered. A meaningful chunk of the fixed cost of living is no longer dependent on your salary.
£1,000/month — resilience begins
This is the milestone where financial resilience starts to feel tangible. If you lost your job tomorrow, you wouldn't be in immediate crisis. You have a month to find something without the panic of fixed costs piling up.
£2,000/month — independence
The FIRE target from episode S1E03. At 3.4% net yield, this requires a portfolio of approximately £706,000. Full independence: your dividend income covers your cost of living without requiring employment income.
The net vs gross trap cuts this framework in half
The milestone ladder only works if you're measuring the right thing. And most broker dashboards actively mislead you here.
Your broker shows you gross dividend income: the number before any deductions. For UK stocks in an ISA, gross and net are the same. For US stocks, they are not. The US government withholds 15% at source (assuming you've completed a W-8BEN form). That deduction happens before the money leaves the US, before your broker processes the payment, and before any currency conversion. If you're counting gross dividends from US holdings, you're counting money you'll never receive.
The maths: a US stock paying a 4% gross yield in your ISA delivers approximately 3.4% net after the 15% withholding tax and a small FX conversion fee. On a £35,300 portfolio, that's the difference between £1,412/year gross and £1,202/year net, a £210 shortfall. Count the £100/month gross and call yourself at milestone two; count £100/month net and you haven't reached it yet.
The same applies to UK stocks held in a General Investment Account (GIA) rather than an ISA. Once your dividend income crosses £500/year (the 2025/26 dividend allowance), UK dividend tax applies. At the basic rate, that's currently 8.75%, rising to 10.75% from 6 April 2026. At the higher rate, it rises from 33.75% to 35.75%. The milestones shift upward accordingly.
The rule is simple: always count net income. What arrives in your account after withholding tax, after currency conversion for foreign holdings, and after any applicable UK dividend tax. That's the number that maps to your bills. That's the number that measures your independence journey.
There's a quick check worth doing right now. Open your broker dashboard and find your dividend total for the last twelve months. Then look at whether that figure includes US stocks. If it does, the number shown is almost certainly gross. Subtract 15% from the US dividend portion to get closer to net. The gap on a mixed UK/US portfolio is often 5-10% of the advertised income figure, which is meaningful when you're trying to know whether you've reached a milestone or not.
What 2020 shows about income vs portfolio value
Here's a concrete example of the gap between price and income.
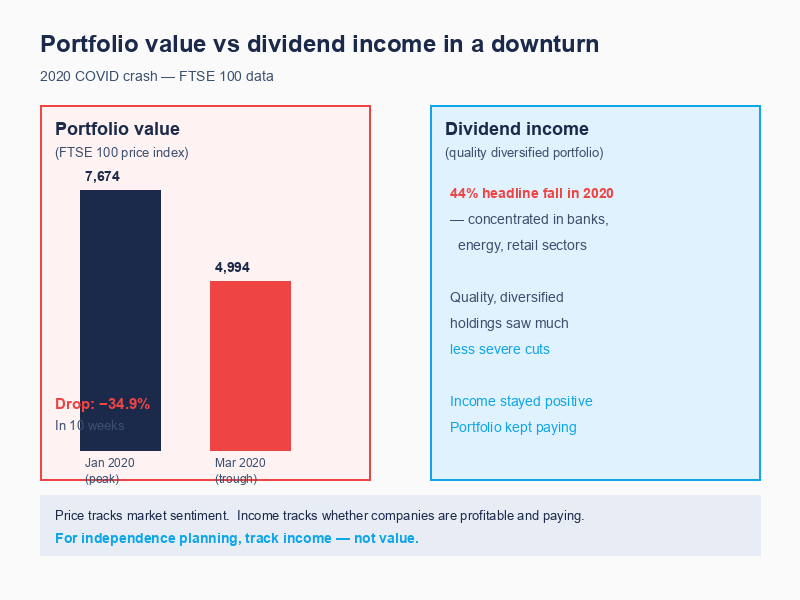
Between 17 January and 23 March 2020, the FTSE 100 price index fell approximately 34.9%, from 7,674 to 4,993. On paper, a £100,000 portfolio became a £65,000 portfolio in ten weeks. For investors tracking portfolio value, this felt like a decade of progress wiped out.
At the same time, UK total dividend payouts fell 44.1% in the full year 2020, with 48 FTSE 100 companies cutting or cancelling dividends. So income wasn't immune either.
But here's the distinction that matters for dividend investors. The income cuts were concentrated in specific sectors: banks were directed to stop dividend payments by the Prudential Regulation Authority, energy companies made their own calls under extraordinary pressure, and some retailers faced existential uncertainty. A diversified portfolio that avoided yield-chasing (episode S1E04 covered why this matters) and held quality payers across sectors would have seen far less severe income cuts than the 44% headline.
The price index recovered to its pre-crash level within roughly fourteen months. But while the price was down, quality holdings continued paying (reduced in some cases, but paying). For someone tracking income milestones rather than portfolio value, 2020 was a setback, not a reversal. The milestones slipped back slightly; they weren't erased.
This is why net income is the more useful progress metric. Price shows you market sentiment. Income shows you whether your companies are generating and sharing profits. For quality holdings, the two can diverge significantly in both directions.
How to see this in your portfolio
Most broker apps show one of two things: a running total of dividends received since January, or a yield percentage. Neither is what you need to track the milestone framework.
A cumulative total since January isn't a monthly run rate. It tells you what you've received, not what your portfolio currently generates per month on a steady-state basis. And a yield percentage doesn't account for withholding tax on foreign holdings, currency conversion, or UK dividend tax in a GIA.
The Nestor Insights tab calculates monthly dividend income after withholding tax and currency conversion. For ISA holdings in UK stocks, the gross and net figures are the same. For US stocks in an ISA, the 15% withholding tax is factored in. For GIA holdings above the dividend allowance, applicable UK tax reduces the figure further.
The Insights tab shows where your current net income sits on the milestone ladder: which bill it covers, what the next milestone is, and how far you are from reaching it. Not a timeline prediction (too many variables apply to individual circumstances), but your current position and the next marker ahead.
The difference between seeing "£87 net monthly income" and "you're 13% from covering your broadband and car insurance" is the difference between a number and a milestone. Both contain the same information, but one of them gives you something to aim at.
The one thing to remember
You started this article with the instinct most dividend investors carry: financial independence is one giant, distant goal. Grind toward £706,000 and see what happens. Check the portfolio value each month and wonder if any of it is working.
The reality is a series of income milestones that become easier to reach as you climb. The first milestone, from zero to £50/month, is the slowest. Every one after comes faster, because the compounding is doing more of the work each time. By the time you're tracking the £1,000 to £2,000 step, the portfolio itself is generating more than £12,000/year toward the next target.
Track the income, not the portfolio value. Count net, not gross. Tie each milestone to a bill you recognise. And when you hit one, acknowledge it. The next one is closer than the last.