You hold US or European dividend stocks. The yield looks fine on screen. The payments arrive each quarter. And whenever anyone raises currency risk, you tell yourself the same thing most UK investors tell themselves: it balances out over time.
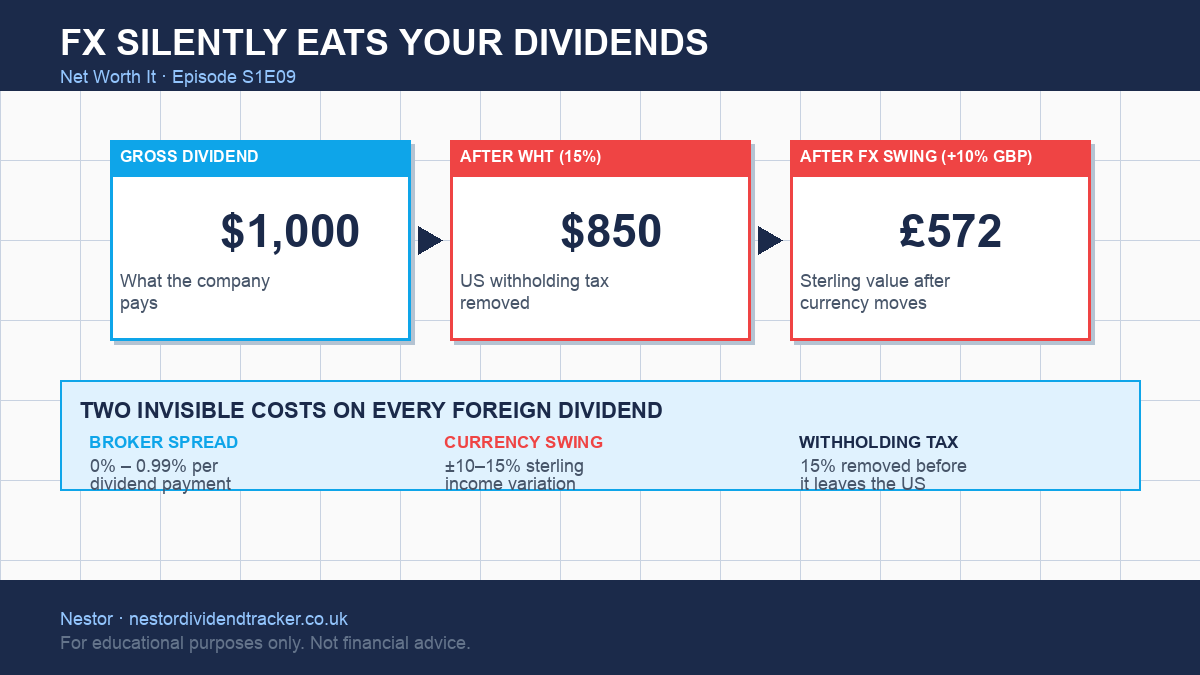
Here is where that gets complicated. Foreign exchange doesn't just fluctuate around your dividend — it hits your dividend twice. First, your broker may take a spread on every single conversion, a fee that compounds quietly across every quarterly payment and never appears as a line item on your statement. Second, GBP/USD can swing 10 to 20 percent in a single year, which means the same dollar dividend from the same stock can land as materially more or fewer pounds depending purely on what the currency happened to be doing when the payment cleared. Combined, those two effects can exceed withholding tax as the biggest invisible drag on your foreign dividend income. And unlike withholding tax, there's no treaty rate. No reclaim mechanism. Nothing to file.
This article unpacks both costs with worked examples, compares them to the withholding tax you already know about, and shows how to tell whether currency is currently helping or hurting your specific portfolio.
Why a 10% GBP move can wipe out more than a year of gains
Start here, because the scale surprises people.
Say you hold a US stock paying $1,000 a year in dividends — a clean round number, no specific company. In 2020, the pound ended the year at approximately 1.3672 against the dollar. At that rate, your $1,000 bought you around £731. In 2022, the pound ended the year at approximately 1.2048, meaning the same $1,000 bought you around £830. That is a £99 swing — a 13.5% difference in your sterling income on an identical dividend from the same company.
The company did nothing different. The dividend was exactly the same in dollars. You just happened to hold it in a different currency year.
Now think about what that means in practice. Your broker shows you a 4% yield. You build your income plan around that. But the sterling figure you actually collect can vary by 13.5% from one year to the next with zero input from you. That is not a rounding error. On a £20,000 position at 4% yield, it is roughly £108 of income variation, every year, from FX alone.
Here is what that year-by-year variation looks like on the same hypothetical $1,000 dividend, converted at each year-end GBP/USD rate:
| Year | GBP/USD (year end) | $1,000 dividend in £ | Year-on-year change |
|---|---|---|---|
| 2019 | 1.3100 | £763 | (base year) |
| 2020 | 1.3672 | £731 | −£32 (GBP strengthened) |
| 2021 | 1.3521 | £740 | +£9 |
| 2022 | 1.2048 | £830 | +£90 (GBP fell sharply) |
| 2023 | 1.2736 | £785 | −£45 |
| 2024 | 1.2515 | £799 | +£14 |
The best year was 2022, when the pound fell sharply. The worst was 2020. The difference between those two years: £99, or 13.5% of sterling income. The company paid the same dividend every single year.
Over the full five-year period from 2020 to 2024, GBP/USD ranged from a low of around 1.03 (at the peak of the Kwarteng mini-budget shock in September 2022) to a high of around 1.42. The annual closing changes were +4.4%, -1.1%, -10.9%, +5.7%, and -1.7%. No pattern, no direction, no balancing. Anyone who held US dividend stocks throughout saw their sterling income rise and fall in ways that had nothing to do with the underlying companies.
The "it balances out" argument is not wrong — it is just measuring the wrong timescale. Over decades, currency movements do tend to mean-revert. Over five years, which is the window most investors actually plan within, the net move can be 10 to 20 percent in either direction and stay there. And the 2022 example is instructive: GBP/USD swung 33% from its January high to its September low in a single calendar year. If your quarterly dividends landed at different points across that range, the conversion rate you received could have differed by 15 to 20% on payments made just months apart from the same stock.
FX drag vs withholding tax: which one costs more
This is the comparison that shifts how most people think about foreign dividends.
Withholding tax is the cost everyone knows. A US company declares a dividend. Before that money leaves the United States, the IRS withholds tax at source. For UK investors who have filed a W-8BEN, the treaty rate is 15%. On $1,000 in gross dividends, you lose $150 before the payment even crosses the Atlantic. You receive $850.
Now convert that $850 at the current GBP/USD rate of approximately 1.35 (mid-market, February 2026). You get about £629.
Here is where the FX comparison gets interesting. If the pound strengthens 10% over the course of the year — which is well within normal range based on the five-year data — that same $850 buys you only about £572. The FX drag from that one currency move: £57.
The withholding tax cost on the original $1,000? About £111 in sterling terms.
So in a year where the pound rises 10%, FX drag equals roughly half the withholding tax cost. In a year where it rises 20%, FX drag equals roughly the same as withholding tax. In the months after the mini-budget, when the pound briefly touched 1.03, UK investors holding US stocks were receiving a currency tailwind of similar magnitude.
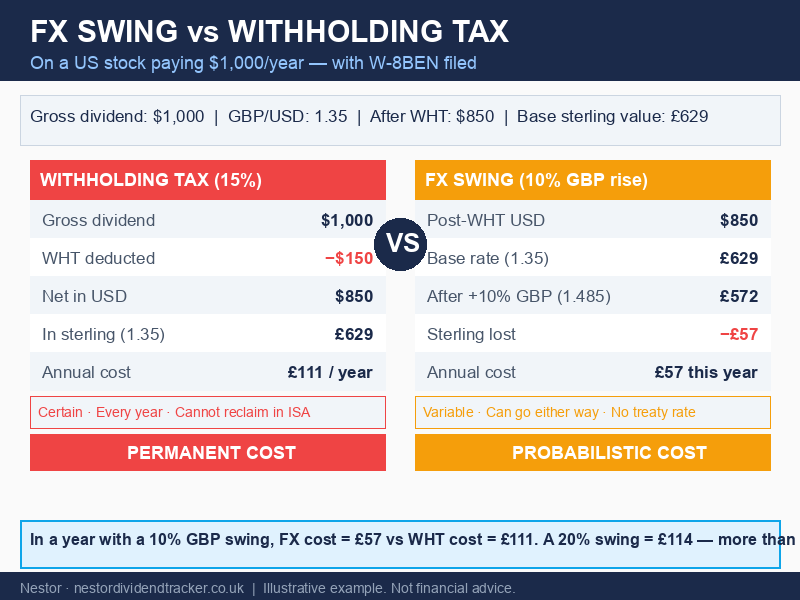
The critical difference is the direction of certainty. Withholding tax is a guaranteed annual cost — same rate, every quarter, no exceptions inside an ISA where you cannot offset it against UK tax. FX movement goes both ways. In a year of sterling weakness, you gain. In a year of sterling strength, you lose. Over time, these may average out. But in any given year, the FX effect can run close to what withholding tax costs, and unlike WHT, there is no form to file, no treaty to consult, and no way to reduce it.
The broker spread: a fee on every payment, invisible on every statement
Currency movement is the bigger story — but the broker spread is the one you can actually control.
When a foreign dividend lands in your account, your broker has to convert it from dollars (or euros, or whatever) into pounds. Every broker handles this differently, and the spread they charge comes directly off the conversion rate you receive. You never see it as a line item. You just get slightly fewer pounds than the mid-market rate would have given you.
The differences between platforms are significant.
| Broker | FX fee on dividend receipts | Notes |
|---|---|---|
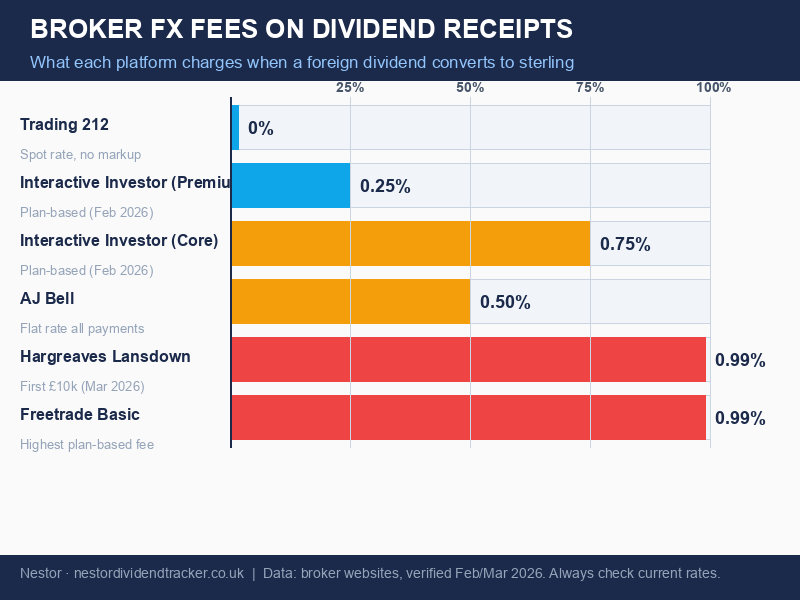
| Trading 212 | 0% (spot rate, no markup) | Applies to cash dividends; Pie reinvestments count as trades (0.15%) |
| Interactive Investor (Premium plan) | 0.25% flat | Plan-based, restructured February 2026 |
| AJ Bell | 0.50% flat | Applied to all foreign dividend and corporate action conversions |
| Interactive Investor (Core plan) | 0.75% flat | Standard plan rate |
| Hargreaves Lansdown | 0.99% on first £10k (tiered) | New structure effective 1 March 2026; drops to 0.50% on next £15k, 0.20% above £25k |
| Freetrade | 0.39%–0.99% | Plan-based; Basic plan at 0.99%, Plus at 0.39% |
The T212 number is worth pausing on. Trading 212 converts your foreign dividends at the mid-market spot rate with zero broker markup. AJ Bell charges 0.50% flat on every dividend conversion. On a £629 dividend receipt, that is £3.15 gone. Small per payment — but that same stock pays quarterly, and you hold multiple international positions.
There is one wrinkle with T212. If you use their Pie feature and dividends get automatically reinvested, the reinvestment counts as a trade rather than a dividend receipt. Trades attract T212's standard 0.15% FX fee. So if you run a Pie, you are paying 0.15% on every reinvestment. For a straightforward cash dividend landing in your account, the fee is zero.
T212 also added a multi-currency feature in 2024. If you enable it, your USD dividends stay as dollars in a USD sub-account. No conversion happens at all until you choose to convert. This effectively removes the broker spread entirely on dividend receipts — and lets you decide when to convert rather than having it happen at the payment date rate.
Why your broker statement hides this from you
The cost is invisible by design — not through deliberate concealment, but because of how currency conversion works mechanically.
When your broker converts a dollar dividend to pounds, they apply a rate. That rate includes their spread. Your statement shows you the pound amount you received. It does not show you the mid-market rate at the moment of conversion, and it does not show you the difference between what you received and what you would have received at mid-market. There is no "FX fee: £3.15" line. The cost is baked into the exchange rate itself.
This makes comparison almost impossible without external data. You would need to know the exact GBP/USD mid-market rate at the precise moment your dividend was converted, then compare it to the rate implied by what you received. Almost nobody does this. Almost nobody can, without building a spreadsheet that pulls historical FX rates per timestamp.
The broker spread and the currency movement also interact in ways that are hard to disentangle. A bad conversion rate on a specific payment date could be the broker's spread, or it could be that the pound happened to be stronger that morning than when you checked it. Without per-payment rate data, you cannot tell which is which.
You can try to check this manually. Take a recent dividend payment: find the date it was credited, look up the GBP/USD mid-market rate for that date on xe.com, and calculate what you should have received at mid-market. Compare that to what actually landed. The difference is approximately your broker's FX spread on that payment. On a £600 dividend receipt with a 0.50% spread, you are looking for a £3 discrepancy. It is small per payment — which is why brokers can charge it without most customers noticing — but it shows up consistently on every payment.
Most people who try this exercise are surprised how rarely they can reconstruct the rate their broker used. The data is rarely surfaced anywhere in a standard account statement. Some brokers will provide it if you call or submit a data request, but it is not standard reporting. That is the structural problem: the cost is real, it accrues every quarter, and the information needed to verify it is not presented to you by default.
The real cost of geographic diversification
There is a useful frame for thinking about all of this. Last episode, we covered why geographic diversification makes sense for UK dividend investors — UK funds have reduced their domestic equity allocation from around 25% to around 10% of assets under management over the past decade, while North American exposure has roughly doubled to around 40%. The case for international income is solid.
But every international holding comes with currency built into the price. When you buy a US stock, you are implicitly also buying a position in GBP/USD. Not consciously, not deliberately, but structurally. Every dividend payment from that stock will be converted at whatever rate exists when the payment clears.
The FX costs in this article are not a reason to avoid international stocks. The diversification arguments still stand. But they are a reason to model your expected sterling income conservatively, to know which broker is taking the least from your conversions, and to track your actual per-payment conversion rates rather than assuming the yield percentage on screen translates directly to pounds in your account.
On a US dividend portfolio yielding $5,000 a year, the difference between a platform charging 0.50% on dividend conversions and one charging 0% is £18.50 per year at current rates. That is not a fortune. But stacked against 5 to 10 years of compounding, across multiple international positions, it accumulates. And it is entirely avoidable.
How to see this in your portfolio
Nestor records every dividend payment in the currency it was paid in, then shows you the sterling equivalent at the conversion rate that applied on that specific payment date. This means for each dollar dividend you receive, you can see the rate that was used — not just the pound total.
Over a year of quarterly payments from the same stock, you will see the spread between your best-rate payment and your worst-rate payment. On a volatile currency pair like GBP/USD, that spread can be meaningful. The difference between a payment that converted at 1.28 and one that converted at 1.38 is roughly 7% of sterling income on an identical dollar amount.
The app also calculates your net yield — not the headline percentage on the broker screen, but the actual sterling income you received divided by the current value of your position. That calculation accounts for withholding tax already deducted and the FX conversion that happened. The number you see is what you kept, not what was advertised.
For anyone building a portfolio across multiple international markets, this is the view that makes FX costs visible instead of invisible.
The one thing to remember
You came into this article thinking FX was a background variable that roughly balances out. What the data shows is that it is two costs running in parallel: currency movement that can swing your sterling income by 10 to 15 percent in either direction with no action from you, and a broker spread that compounds quietly on every dividend payment and never shows up as a line item.
Combined, they can rival withholding tax as the biggest invisible drag on foreign dividend income. And unlike withholding tax, there is no treaty to reduce them.
The yield on your broker screen is the yield before the currency got involved. What you actually keep is something else.