You have ten stocks. Different company names, different share prices, different sectors listed on your broker screen. Feels diversified. But here is the question worth asking before you feel comfortable with that picture: are they all making the same underlying bet?
In 2020, that question got answered brutally for a lot of UK investors. Banks were formally instructed to suspend dividends. Shell cut its payment by 66% — the first reduction since the Second World War. BP followed with a 50% cut. Investors who thought they had a spread of income sources watched their cash flow collapse almost overnight.
The issue was not that they owned too few stocks. It was that they were diversified across company names but concentrated across sectors, geographies, and payment schedules. Those are three very different things.
This article covers what genuine income diversification looks like — and why it serves a different purpose than the diversification growth investors talk about.
The Hidden Concentration in "Typical" UK Portfolios
Ask a UK dividend investor to describe their portfolio and you often hear something like: Shell, BP, a couple of banks, British American Tobacco, Unilever. Ten stocks, different names, different industries. Energy. Finance. Consumer goods.
On the surface, that sounds like a spread. But look at what those holdings actually represent in the UK market's structure.
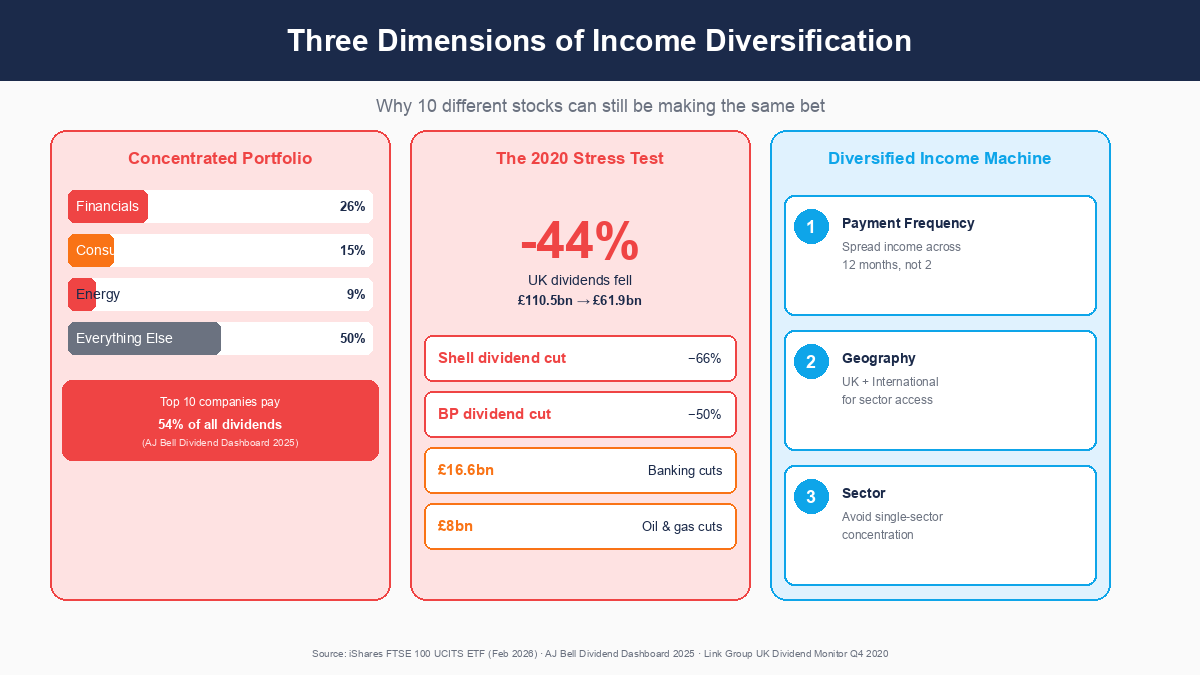
According to iShares data from February 2026, financials make up approximately 26% of the FTSE 100 by weight. Energy is another 9.45%. Consumer staples — which includes names like Unilever and BAT — is roughly 15-15.5%. Three broad sector groups alone account for over half the index. And AJ Bell's Dividend Dashboard data shows that financials, oil and gas, and mining together account for approximately 47-48% of all FTSE 100 ordinary dividend payments.
The top ten holdings in the FTSE 100 — HSBC, AstraZeneca, Shell, Unilever, Rolls-Royce, BAT, GSK, BP, Rio Tinto, and Barclays — represent roughly 48% of the entire index by weight. Ten companies pay 54% of all FTSE 100 dividends (AJ Bell Dividend Dashboard 2025, £43.2 billion projected).
What this means in practice: if you hold a FTSE 100 tracker fund and then add a handful of individual UK names — Shell, Barclays, a couple of other big payers — you are not supplementing the index. You are doubling down on the most concentrated sectors within it. Your "diversified" portfolio may be more concentrated in banks and energy than you realise.
| FTSE 100 Sector | Index Weight | Notes |
|---|---|---|
| Financials | ~26% | Banks, insurers |
| Consumer Staples | ~15-15.5% | Unilever, BAT, etc. |
| Industrials | ~14-15% | Diverse sub-sectors |
| Health Care | ~14-14.5% | AstraZeneca, GSK |
| Energy | ~9.5% | Shell, BP |
| Basic Materials | ~7% | Mining companies |
| Consumer Discretionary | ~5% | Retail, leisure |
| Utilities | ~4.5% | Water, electricity |
| Communications | ~2% | BT, Vodafone |
| Information Technology | ~1% | Barely present |
Source: iShares Core FTSE 100 UCITS ETF factsheet, February 2026
The technology row is worth pausing on. The FTSE 100 allocates less than 1% of its weight to information technology. In the US market — measured by the S&P 500 — technology represents over 30% of the index. If you hold UK stocks only, you have almost no exposure to one of the economy's most productive sectors. That is not inherently wrong, but it is worth knowing.
What the 2020 Stress Test Revealed
The concentration hidden in typical UK portfolios became visible in 2020. It is worth walking through exactly what happened, because the numbers are stark.
On March 31, 2020, the Bank of England's Prudential Regulation Authority issued a formal request to seven major UK banks — Barclays, HSBC, Lloyds, NatWest, Nationwide, Santander UK, and Standard Chartered — asking them to cancel their 2019 final dividends and suspend distributions until the end of 2020. Not a request that could easily be declined.
On April 30, 2020, Shell announced a 66% cut to its quarterly dividend — from $0.47 to $0.16 per share. The first dividend cut since the Second World War.
On August 4, 2020, BP announced a 50% cut — from 10.5 cents to 5.25 cents per quarter.
The aggregate impact was severe. Link Group's UK Dividend Monitor reported that total UK dividends in 2020 fell to £61.9 billion — down 44.1% from £110.5 billion in 2019. Approximately two-thirds of UK companies cut or cancelled distributions between Q2 and Q4 2020. Financials alone accounted for £16.6 billion of cuts. Oil and gas accounted for a further £8 billion. Together, those two sectors were responsible for roughly 62% of all the cuts.
An investor whose income was concentrated in UK banks and energy companies could have seen their annual dividend income approximately halve. That is not a paper loss on share price — it is a reduction in actual cash arriving in the account.
This is the stress test that defines what income diversification means. It is not about dampening portfolio volatility. It is about protecting the reliability of cash flow when a sector stumbles.
Three Dimensions That Most Investors Overlook
Income diversification has three components that work independently of each other. Most investors think mainly about the third.
1. Payment Frequency Diversification
Most UK stocks are semi-annual payers — they issue an interim dividend and a final dividend, typically landing in May and again in September or October. January and July are the quietest months in the FTSE 100 dividend calendar.
If your entire portfolio follows this pattern, the income calendar looks something like this:
| Month | UK Semi-Annual Portfolio | Mixed Frequency Portfolio |
|---|---|---|
| January | £0 | Moderate |
| February | £0 | Moderate |
| March | £0 | Moderate |
| April | £0 | Moderate |
| May | Large payment | Good |
| June | £0 | Moderate |
| July | £0 | Moderate |
| August | £0 | Moderate |
| September | Large payment | Good |
| October | Moderate | Moderate |
| November | £0 | Moderate |
| December | £0 | Moderate |
Six months of near-zero income followed by two large payments. For a growth investor this is irrelevant — reinvested dividends work whenever they arrive. For an income investor trying to plan cash flow, or anyone approaching the point where dividends supplement living expenses, feast-and-famine is genuinely harder to manage.
US stocks typically pay quarterly — four payments spread through the year. Some US REITs take this further. Realty Income (ticker: O, listed on NYSE) pays monthly and is sometimes called "The Monthly Dividend Company." Worth noting: US stocks held in a GIA or ISA attract 15% US withholding tax (with a W-8BEN form filed), as covered in episode five of this series. Monthly income has a price tag attached.
One common misconception worth clearing up: the City of London Investment Trust (CTY) is frequently cited as a monthly-paying trust. It is not. CTY pays quarterly — February, May, August, and November. It holds a remarkable 58-consecutive-year record of dividend increases, which earns it AIC Dividend Hero status, but monthly it is not. Monthly-paying investment trusts listed in the UK are genuinely rare. TwentyFour Select Monthly Income (SMIF) is the most prominent, but it invests in fixed-income securities, not equities.
2. Geographic Diversification
The geographic dimension involves a genuine trade-off, and it is worth being clear-eyed about both sides.
Holding UK stocks only means exposure to the FTSE 100's structural concentrations — heavy financials, energy, and consumer staples; almost no technology; limited healthcare compared to global markets. Adding international stocks reduces those concentrations and provides access to sectors that simply do not exist meaningfully in UK markets.
The cost is withholding tax drag. US stocks attract 15% WHT. European stocks attract varying rates — some higher. As covered in episodes five and six of this series, that drag reduces your net yield from international holdings compared to what you would receive on an equivalent UK stock.
The trade-off, then: you pay a bit more in tax drag for a different risk profile and broader sector exposure. A blended portfolio will tend to produce a lower raw yield than a UK-only portfolio — but the income may prove more resilient across different economic conditions, because not all sectors stumble at the same time or for the same reasons.
Whether that trade-off makes sense for your situation is a decision that depends on your income targets, your tax position, and how you weight reliability against yield. There is no universal right answer — but knowing the trade-off exists is the prerequisite for making it deliberately.
3. Sector Concentration
The third dimension is sector concentration — and 2020 is the clearest illustration of why it matters for income investors specifically.
Different sectors have different dividend characteristics:
| Sector | Typical Characteristics | 2020 Stress Test |
|---|---|---|
| Financials (Banks) | High yields, regulatory risk | Dividends suspended by PRA instruction |
| Energy (Oil & Gas) | High yields, commodity cyclicality | Shell -66%, BP -50% |
| Consumer Staples | Resilient yields, lower growth | Generally resilient but not immune |
| Health Care | Moderate yields, defensive | Relatively well-maintained |
| Utilities | Stable, regulated, lower yields | Generally maintained |
| Technology | Low/no yield, high growth | Growth-focused, few payers |
| Mining | Highly cyclical, variable dividends | Cuts common in downturns |
The practical insight is not just about which sector pays more today. It is about what happens to those payments when conditions deteriorate — and whether the conditions that hurt one sector also hurt another.
Energy and financials were both hit hard in 2020, but for different reasons (commodity price collapse versus regulatory capital requirements). An investor concentrated in both was doubly exposed. A portfolio that also included defensive utilities, healthcare, and some international technology exposure would have seen part of its income survive intact — not because those sectors are inherently better, but because they respond to different forces.
A Practical Diversification Audit
The diversification audit does not require a formula. It requires three honest questions.
Question 1: What percentage of your dividend income comes from a single sector?
Note that this is not the same as asking what percentage of your portfolio by value sits in a sector. A stock worth 10% of your portfolio value might deliver only 3% of your dividend income if its yield is low. The relevant concentration is income concentration, not value concentration.
If a single sector provides more than 30% of your expected annual dividends, that is worth being aware of — not necessarily changing, but understanding. Some investors consciously choose to concentrate in high-yielding UK sectors and accept the associated risk. That is a perfectly legitimate approach, as long as it is a deliberate choice.
Question 2: Are there months in the year with zero income?
If the answer is yes for multiple consecutive months, you are holding predominantly UK semi-annual payers with a clustered payment schedule. That is fine for growth portfolios. For income planning, it creates behavioural and practical cash flow risks.
Question 3: What share of your dividends comes from UK versus international sources?
This tells you your geographic concentration. A 100% UK portfolio is not wrong — but it means you are fully exposed to whatever structural risks the UK market faces, and you have no access to sectors (particularly technology) that barely exist here.
The point of the audit is not to arrive at any particular answer. It is to turn what might be an accidental position into a deliberate one.
Income Diversification vs Growth Diversification
There is a distinction here that is worth making explicit, because it changes how you think about portfolio construction.
Growth investors diversify primarily to reduce price volatility. They spread across asset classes, geographies, and sectors so that when one part of the portfolio falls in value, another part holds up. The goal is a smoother ride on the price chart.
Income investors are diversifying for a different purpose: to protect the reliability of cash flow. Price volatility matters less if you are not selling. What matters is whether dividends keep arriving, in what quantities, and on what schedule.
This is a subtly different goal. A portfolio that is "well diversified" by growth standards — spread across many stocks in uncorrelated sectors — can still be highly concentrated from an income perspective, if the high-yielding names all cluster in the same sectors and payment windows.
The practical implication: income investors should evaluate their diversification from the perspective of dividend income flows, not portfolio value weights. Which sectors are generating most of the cash? In which months does it arrive? From which geographies?
A portfolio concentrated by income in two sectors and two payment months carries hidden income risk regardless of how many different company names appear in the holdings list.
How to See This in Your Portfolio
Nestor's diversification views on the portfolio screen break down your holdings across six different lenses — including sector, geography, and payment frequency. Critically, the sector breakdown shows income concentration rather than value concentration. A stock worth 10% of your portfolio by market value might be contributing only 3% of your dividend income — or it might be contributing 20%. The value weighting tells you one thing; the income weighting tells you something quite different.
The payment frequency view maps your income calendar — which months have payments scheduled and which months are empty. If you import your Trading212 CSV files, Nestor plots your dividend income across the calendar year based on your actual holdings and historical payment schedules.
The geographic breakdown shows your UK versus international split, so you can see at a glance what proportion of your income carries withholding tax drag and what proportion does not.
The point of these views is not to tell you what the right diversification looks like — that depends on your income targets, timeline, and risk tolerance. It is to make the concentration visible so you can make a deliberate choice rather than discovering the concentration when a sector stumbles.
The One Thing to Remember
For income investors, diversification is not about reducing how much your portfolio fluctuates in price. It is about protecting how reliably dividends keep arriving.
Knowing where your income is concentrated — across sectors, geographies, and the payment calendar — is what lets you make that concentration a deliberate choice rather than a surprise waiting to materialise.
Choose deliberately. Do not be surprised accidentally.